为什么IGCSE理科科目比国内课程难?
一直以来不管是在体制内还是国际课程,数理化始终都是让大家头疼的科目!最近,the british exams网站的这份调查结果,理科几乎全上榜! 图源the british exams 为什么IGCSE理科科目比国内课程难? 首先,IGCSE理...

一直以来不管是在体制内还是国际课程,数理化始终都是让大家头疼的科目!最近,the british exams网站的这份调查结果,理科几乎全上榜! 图源the british exams 为什么IGCSE理科科目比国内课程难? 首先,IGCSE理...
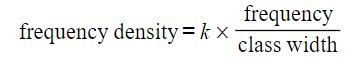
Histograms What is a histogram? A histogram is similar to a bar chart but with some key differences A histogram is for displaying grouped continuous data whereas a bar chart is for discrete or qual...
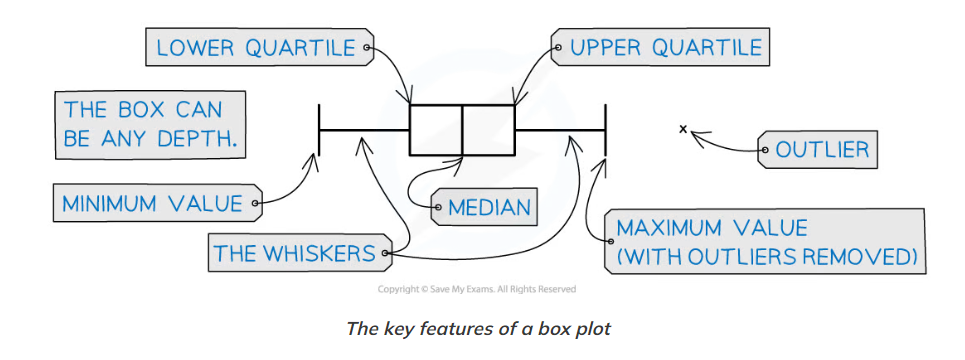
Box Plots What is a box plot? A box plot is a graph that clearly shows key statistics from a data set It shows the median, quartiles, minimum and maximum values and outliers It does not show any ot...
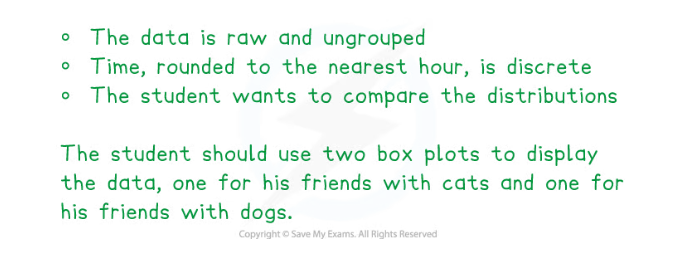
Data Presentation What graphs and diagrams should I be familiar with? You will be expected to be able to use a variety of graphs such as: Box plots Can be used with ungrouped data of a single varia...

Coding Sometimes data needs to be coded for further use with calculations. This is particularly useful with data that deals with very small or very large numbers, or with data that needs to be clas...

Standard Deviation & Variance The variance is another measure for the spread of the data, it measures the variability from the mean of the data. What is the variance and the standard deviation?...

Frequency Tables In most cases in your statistics course, you will come across data that is presented in a frequency table. These allow data to be summarised and make them easier to work with. Ungr...

Mean, Mode, Median What are mean, median and mode? Mean, median and mode are measures of location A measure of location gives information about where data is in the number system Mean, median and m...

Types of Data What are the different types of data? Qualitative data is data that is usually given in words not numbers to describe something For example: the colour of a teacher's car Quantitative...


