Edexcel A Level Economics A:复习笔记2.6.2 Demand-side Policies

Demand-side Policies
- Demand-side policies aim to shift aggregate demand (AD) in an economy
- There are two categories of demand-side policies
- Fiscal policy and monetary policy
- Fiscal policy involves the use of government spending and taxation to influence AD
- The government is responsible for setting fiscal policy
- The UK Government presents their fiscal policies to the country each year when it delivers the Government budget
- Monetary policy involves adjusting interest rates and the money supply so as to influence AD
- The Bank of England (UK central bank) is responsible for setting monetary policy
- The Bank's Monetary Policy Committee meets 8 times a year to set policy
Monetary Policy Instruments
- The two main instruments of monetary policy include
- Incremental adjustments to the interest rate (usually not more than 0.25%)
- Quantitative easing which increases the supply of money in the economy
- The Central Bank creates new money and uses it to buy open-market assets
- When a policy decision is made, it creates a ripple effect through the economy and this effect is known as a transmission mechanism
Incremental Changes to Interest Rates
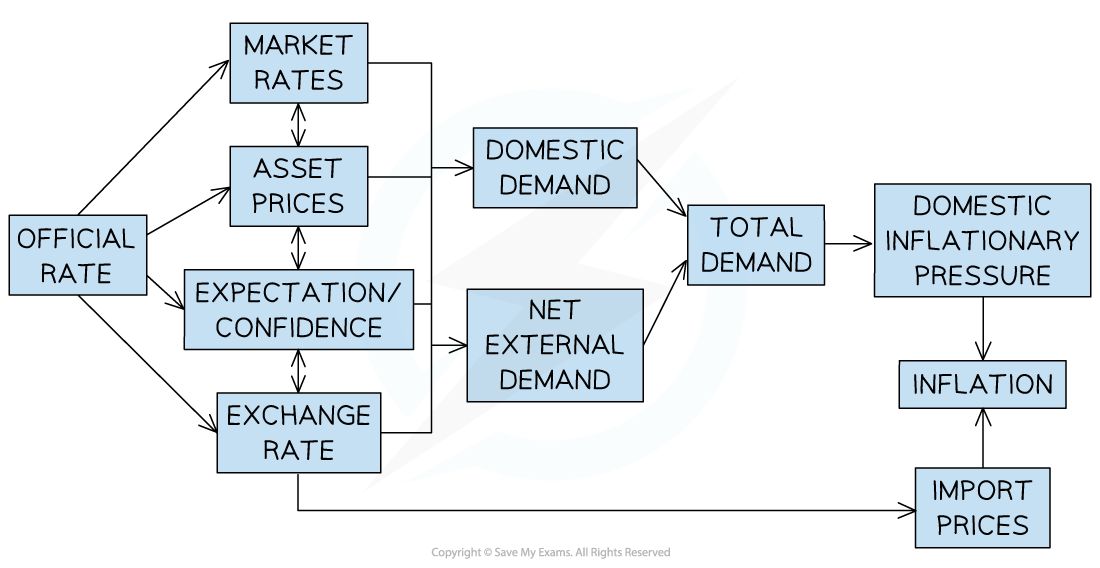
The transmission mechanisms of changes to the interest rate
Before Explaining a Mechanism from the Diagram Above, Key Terminology Can Be Reviewed Below
| Official Rate | Market Rates | Asset Prices |
| Exchange Rate | Net External Demand | Inflation |
Example 1
- Official rate decreases by 0.25% → market rates decrease → loans are cheaper → consumers borrow more → consumption increases → AD increases → inflation increases
Example 2
- Official rate decreases by 0.25% → market rates decrease → mortgages are cheaper → property buyers borrow more → demand for houses increases → asset prices increase
Example 3
- Official rate decreases by 0.25% → market rates decrease → buyers borrow more → asset prices increase → households with assets feel wealthier → consumption increases → AD increases → inflation increases
Example 4
- Official rate increases by 0.25% → hot money flows increase → the exchange rate appreciates → exports more expensive and imports cheaper → net exports reduce → AD decreases → inflation decreases
Example 5
- Official rate increases by 0.25% → market rates increase → existing loan repayments now more expensive to repay → discretionary income falls → consumption decreases → AD decreases → inflation decreases
Quantitative Easing Transmission Mechanism
- The Bank of England commits to buy £60bn of gilts a month → commercial banks receive cash for their gilts → liquidity in the market increases → commercial banks lower lending rates → consumers and firms borrow more → consumption and investment increase → AD increases → inflation increases
Fiscal Policy Instruments
- Fiscal Policy involves the use of government spending and taxation to influence aggregate demand in the economy
- Government spending includes direct expenditure, but not transfer payments
- Transfer payments are part of fiscal policy, but are not counted as government spending in the AD formula
- Transfer payments enter the circular flow when the recipients spend them
- Transfer payments are part of fiscal policy, but are not counted as government spending in the AD formula
Fiscal Policy Impacts
Example 1
- The Government increases VAT from 20% to 22% → consumers pay more tax → discretionary income reduces → consumption reduces → AD reduces → inflation eases
Example 2
- The Government decreases corporation tax → firms net profits increase → investment by firms increases → AD increases → inflation increases
Example 3
- The Government freezes/reduces public sector pay → consumer confidence falls → consumption decreases → AD decreases → inflation decreases
Example 4
- The Government increases the allowances in the Universal Credit (unemployment benefits) → household income increases → consumption increases → AD increases → inflation increases
Government Budget (Fiscal) Deficit & Surplus
- The Government Budget (Fiscal policy) is presented each year as a balanced budget, a budget deficit, or a budget surplus
- A balanced budget means that government revenue = government expenditure
- A budget deficit means that government revenue < government expenditure
- A budget surplus means that government revenue > government expenditure
- A budget deficit has to be financed through public sector borrowing
- This borrowing gets added to the public debt
Direct & Indirect Taxation
- The main source of government revenue is taxation
- Direct taxes are taxes imposed on income and profits
- They are paid directly to the government by the individual or firm
- E.g. Income tax, corporation tax, capital gains tax, national insurance contributions, inheritance tax
- They are paid directly to the government by the individual or firm
- Indirect taxes are imposed on spending
- The supplier is responsible for sending payment to the government
- Depending on the PED and PES producers are able to pass on a proportion of the indirect tax to the consumer
- The lower a consumer spends the less indirect tax they pay
- E.g Value Added Tax (20% VAT rate in the UK in 2022), taxes on demerit goods, excise duties on fuel etc.
- The supplier is responsible for sending payment to the government
Diagrams to Illustrate Demand-side Policies
Expansionary Demand-side Policies
- Demand-side policies that aim to increase aggregate demand are called expansionary policies
- Expansionary monetary or fiscal policy will shift aggregate demand to the right
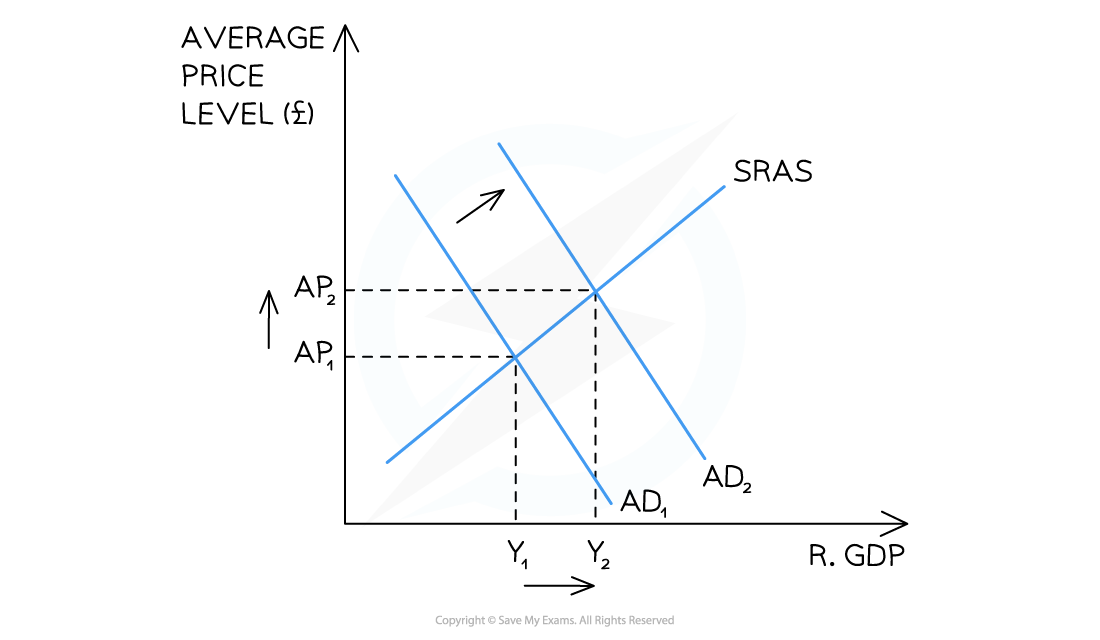
Classical diagram illustrating expansionary demand-side policies which increase real GDP (Y1 →Y2) and average price levels (AP1 →AP2)
Expansionary Policies Include
- Reducing taxes; decreasing interest rates; increasing government spending; increasing quantitative easing
Contractionary Demand-side Policies
- Demand-side policies that aim to decrease aggregate demand are called contractionary policies
- Contractionary monetary or fiscal policy will shift aggregate demand to the left
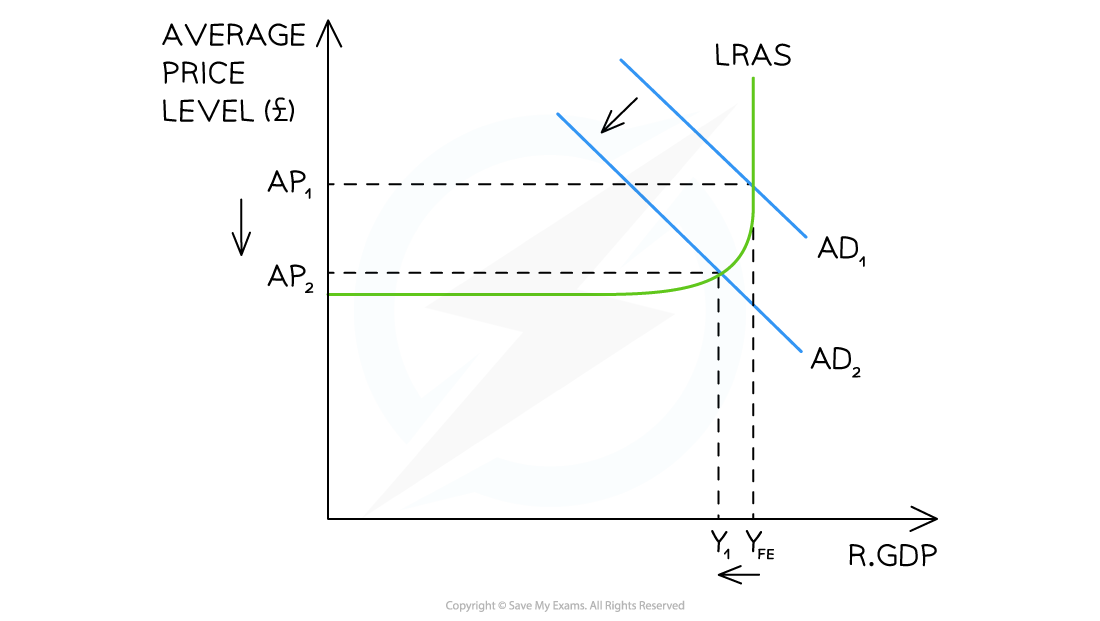
Keynesian diagram illustrating contractionary demand-side policies which decrease real GDP (YFE →Y1) and average price levels (AP1 →AP2)
Contractionary Policies Include
- Increasing taxes; increasing interest rates; decreasing government spending; decreasing/stopping quantitative easing
The Role of the Bank of England
- The Bank of England's Monetary Policy Committee (MPC) consists of nine members
- They meet 8 times a year to set the monetary policy
- At this meeting they set the Bank Rate and discuss if quantitative easing is required (or should continue)
- Policy is decided by majority vote
- It can take up to two years for the full effects of decisions to be seen in the economy
- The single most important consideration in their deliberations is the inflation target of 2% CPI
A Table That Explains Some of the Factors That Influence the Decision Made by The MPC
| Without further intervention, the likely state of the economy a few months ahead | Rate of real GDP growth (output gaps?) |
Current level of CPI Inflation |
| Interest rate elasticity (low confidence = inelastic response) |
State of the property market (Overheating?) |
Unemployment figures |
| Business & consumer confidence | Global outlook | The exchange rates |
Demand-side Policies During the Great Depression & 2008 Global Financial Crisis
- The Great Depression started in the USA in October 1929 and continued until the late 1930's
- By 1932 the USA unemployment rate was around 25%
- More than 9,000 banks closed during this decade
- The flow of money in the economy was weak (poor liquidity)
- The Great Depression created a global slump
- In the UK, unemployment doubled and exports halved leading to a major recession
- The 2008 Global Financial Crisis started in the USA in September 2008 with the collapse of the investment bank, Lehman Brothers
- The crisis was inextricably linked to interest rates and risky lending in the property market
- In total, about 10 million households lost their homes (roughly 1 in every 20 homes)
- Unemployment doubled from around 5% to 10%
- 489 Banks failed in the five-year period following the crisis - most were bailed out by central governments
- The 2008 Global Financial Crisis created a global slump
- UK unemployment rose from 5.2% to 7.8%
A Summary of the Demand-side Policies Used During the Great Depression & 2008 Financial Crisis
| Fiscal Policy | Monetary Policy | |
| Great Depression Policy Responses USA |
|
|
| Great Depression Policy Responses UK |
|
|
| 2008 Financial Crisis Policy Responses USA
|
|
|
| 2008 Financial Crisis Policy Responses UK |
|
|
Strengths & Weaknesses of Demand-side Policies
Strengths of Monetary Policy
- The Bank of England operates independently from the Government (political process)
- Is able to consider the long-term outlook
- Targets inflation and maintains stable prices
- Depreciating the currency can increase exports
Weaknesses of Monetary Policy
- Conflicting goals e.g economic growth puts upward pressure on inflation
- Time lags between policy and the desired impact (up to 2 years)
- Expansionary policy is less effective in negative output gaps than when used with positive output gaps
- Consumers may not respond to lower interest rates when confidence is low
- Cheaper credit can inflate asset prices in the long term
- The interest rate has limitations on downward adjustment
Strengths of Fiscal Policy
- Spending can be targeted on specific industries
- Short time lag as compared with monetary policy
- Redistributes income through taxation
- Reduces negative externalities through taxation
- Increased consumption of merit/public goods
- Short term government spending can lead to an increase in the long-run aggregate supply
- E.g. Building a new airport immediately increases government spending and AD, but when it is built, the potential output will have increased
Weaknesses of Fiscal Policy
- Policies can fluctuate significantly as governing parties' change
- Long term infrastructure projects may lack follow-through
- Increased government spending can create budget deficits
- Repaying this debt may lead to austerity on future generations
- Conflicts between objectives
- E.g. Cutting taxes to increase economic growth may cause inflation
Exam Tip
When evaluating any demand-side policy, avoid generalisations and focus on the effects of the specific policy mentioned. To strengthen any response, fully develop each transmission mechanism as this is part of your 'chain of analysis'. Always conclude by explaining the likely impact on the real GDP and average price levels.
转载自savemyexams
以上就是关于【Edexcel A Level Economics A:复习笔记2.6.2 Demand-side Policies】的解答,如需了解学校/赛事/课程动态,可至翰林教育官网获取更多信息。
往期文章阅读推荐:
翰林独家 | 经济学竞赛核心精讲,一册打通NEC/IEO/USAEBO!
2026 ALEVEL 夏考A率出炉!爱德思vs牛津AQA,哪些科目真的“好出分”?


翰林AMC8视频课重磅上线!

国际竞赛真题资源免费领取






