Edexcel IGCSE Physics 复习笔记 1.1.1 Distance-Time Graphs

Edexcel IGCSE Physics 复习笔记 1.1.1 Distance-Time Graphs
Distance-Time Graphs
- A distance-time graph shows how the distance of an object moving in a straight line (from a starting position) varies over time:
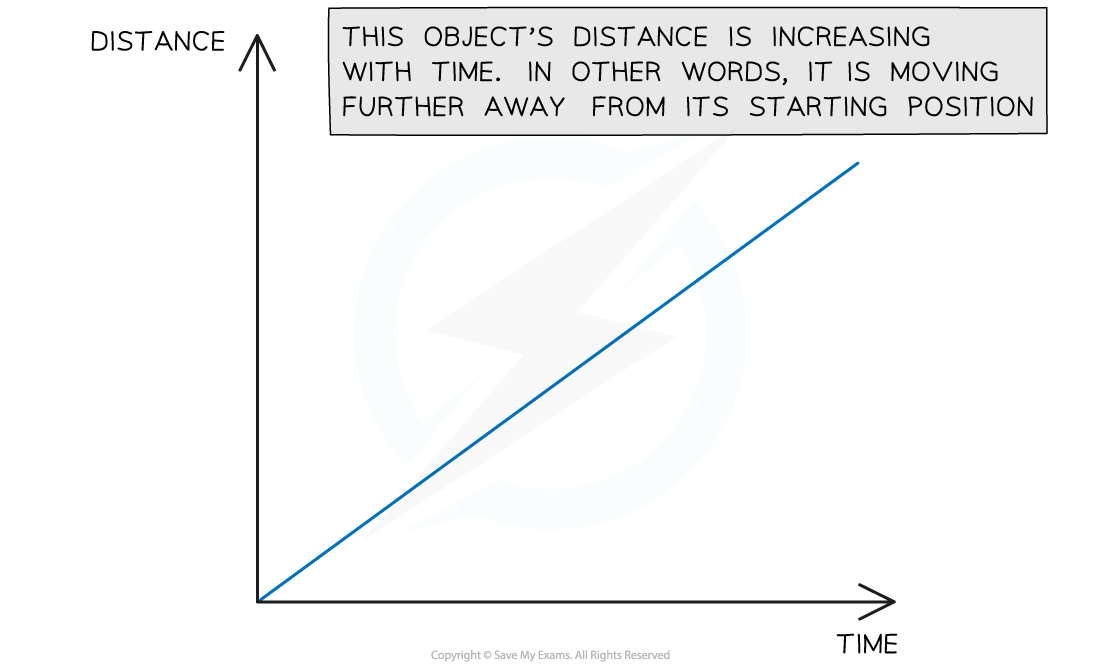
This graph shows a moving object moving further away from its origin
Constant Speed on a Distance-Time Graph
- Distance-time graphs also show the following information:
- If the object is moving at a constant speed
- How large or small the speed is
- A straight line represents constant speed
- The slope of the straight line represents the magnitude of the speed:
- A very steep slope means the object is moving at a large speed
- A shallow slope means the object is moving at a small speed
- A flat, horizontal line means the object is stationary (not moving)
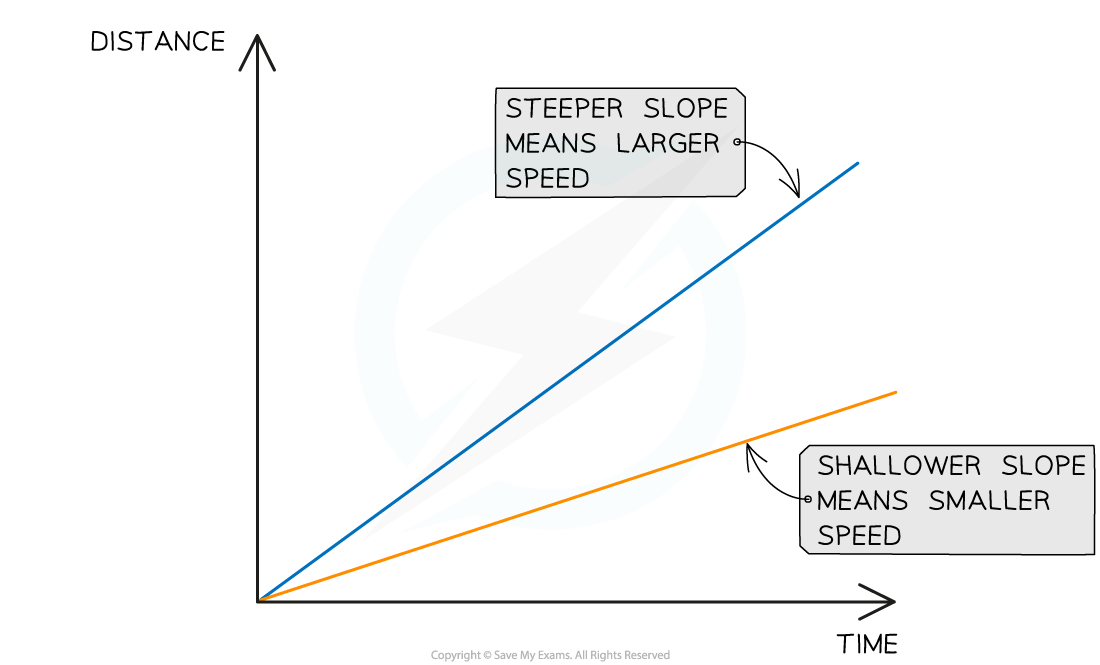
This graph shows how the slope of a line is used to interpret the speed of moving objects. Both of these objects are moving with a constant speed, because the lines are straight.
Changing Speed on a Distance-Time Graph
- Objects might be moving at a changing speed
- This is represented by a curve
- In this case, the slope of the line will be changing
- If the slope is increasing, the speed is increasing (accelerating)
- If the slope is decreasing, the speed is decreasing (decelerating)
- The image below shows two different objects moving with changing speeds
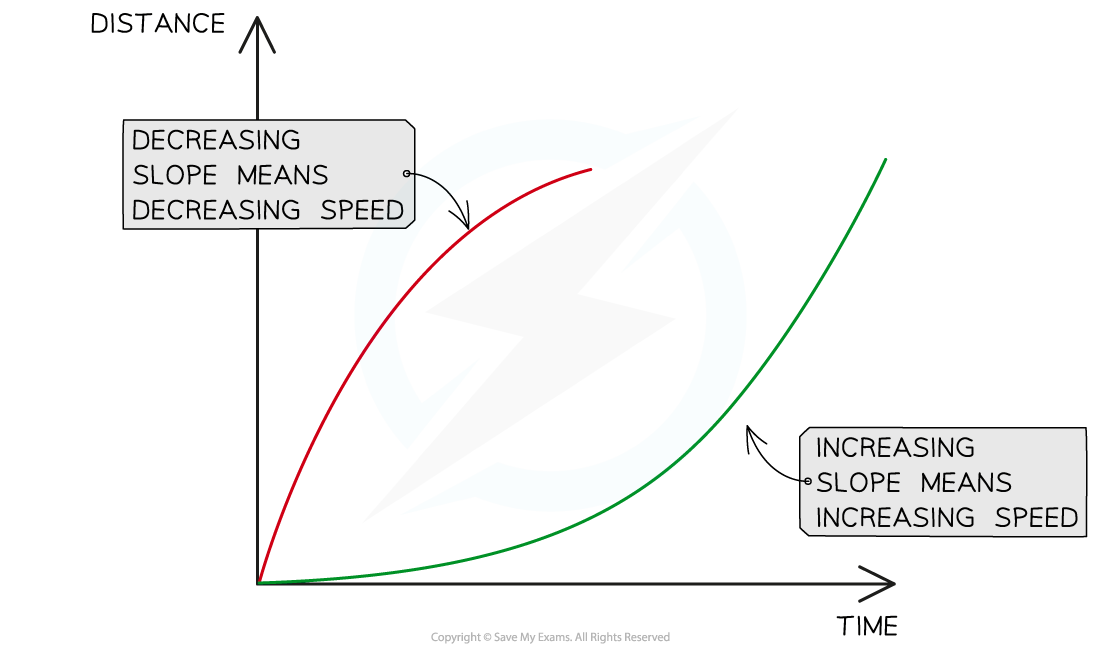
Changing speeds are represented by changing slopes. The red line represents an object slowing down and the green line represents an object speeding up.
Gradient of a Distance-Time Graph
- The speed of a moving object can be calculated from the gradient of the line on a distance-time graph:

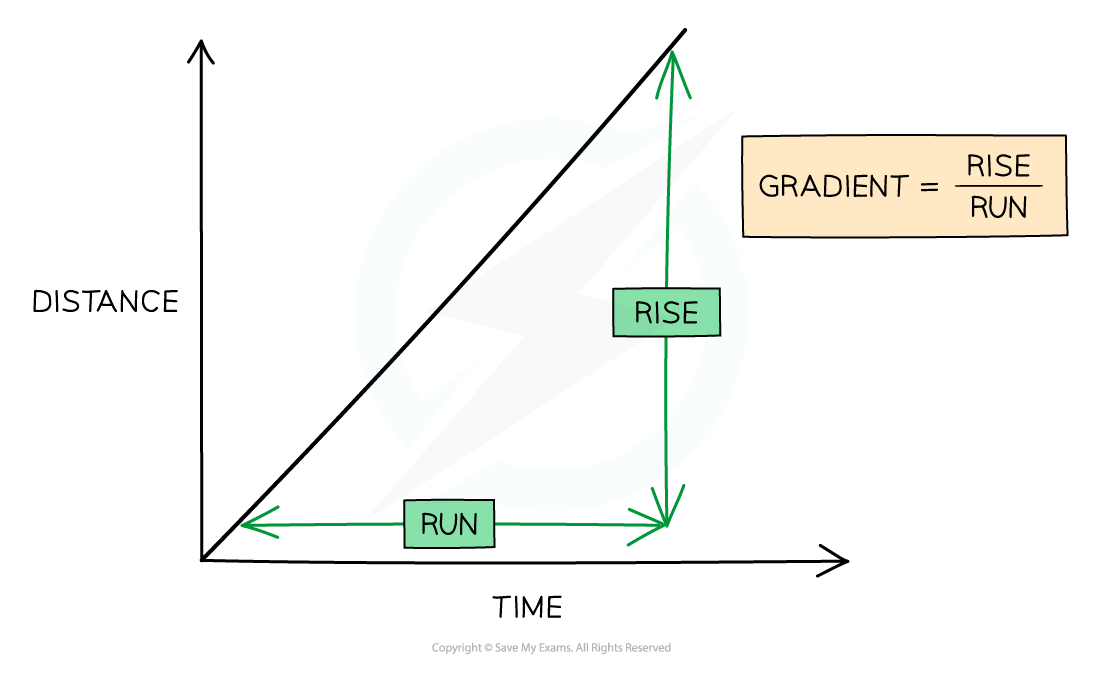
The speed of an object can be found by calculating the gradient of a distance-time graph
- The rise is the change in y (distance) values
- The run is the change in x (time) values
Worked Example
A distance-time graph is drawn below for part of a train journey. The train is travelling at a constant speed.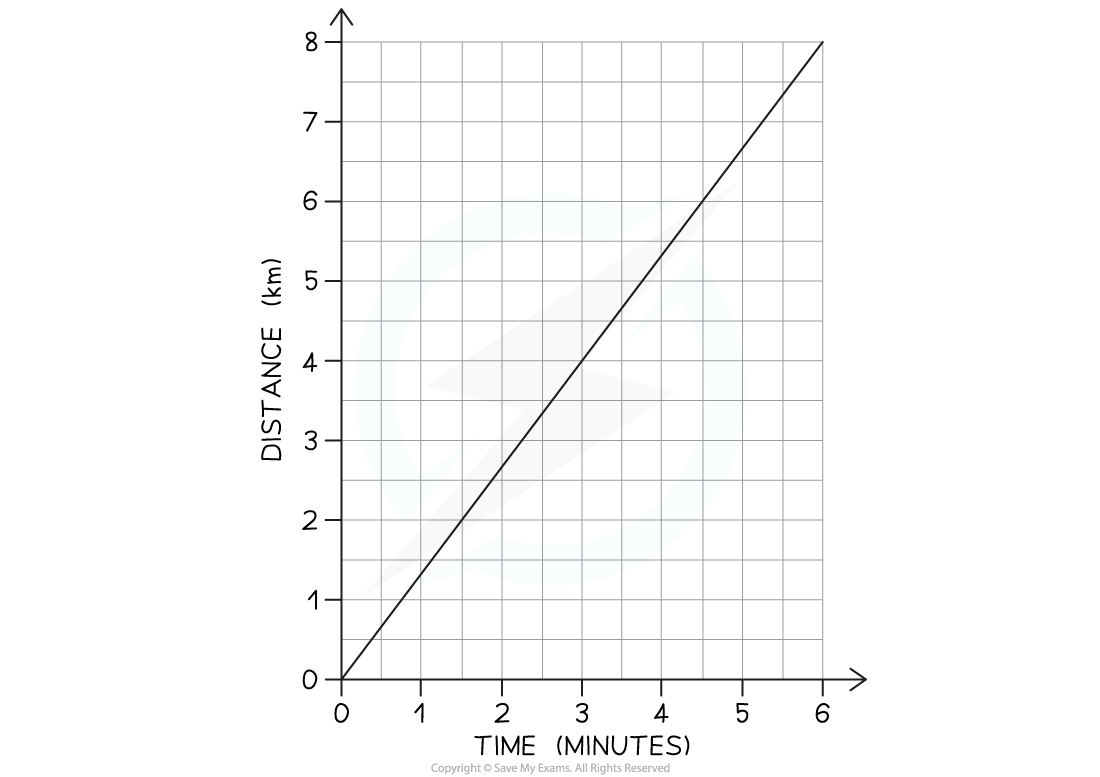 Calculate the speed of the train.
Step 1: Draw a large gradient triangle on the graph and label the magnitude of the rise and run
-
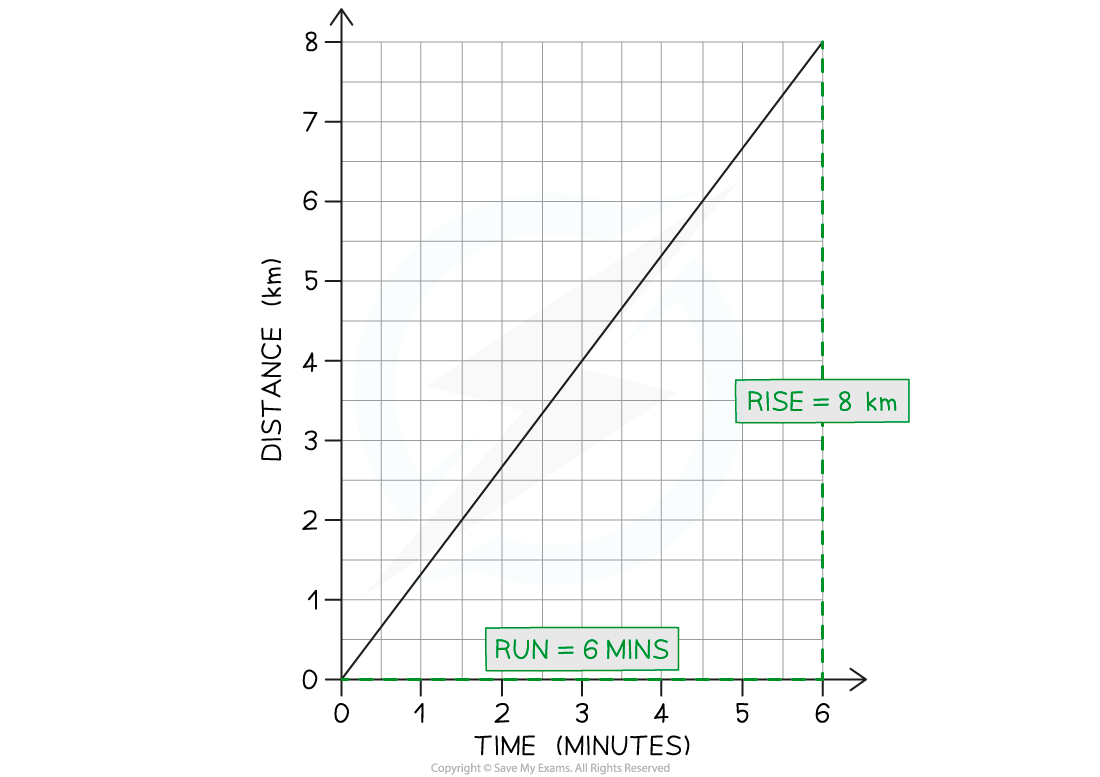
- The image below shows a large gradient triangle drawn with dashed lines
- The rise and run magnitude is labelled, using the units as stated on each axes
Step 2: Convert units for distance and time into standard units
-
- The distance travelled (rise) = 8 km = 8000 m
- The time taken (run) = 6 mins = 360 s
Step 3: State that speed is equal to the gradient of a distance-time graph
-
- The gradient of a distance-time graph is equal to the speed of a moving object:
Step 4: Substitute values in to calculate the speed
speed = gradient = 8000 ÷ 360
speed = 22.2 m/s
Worked Example
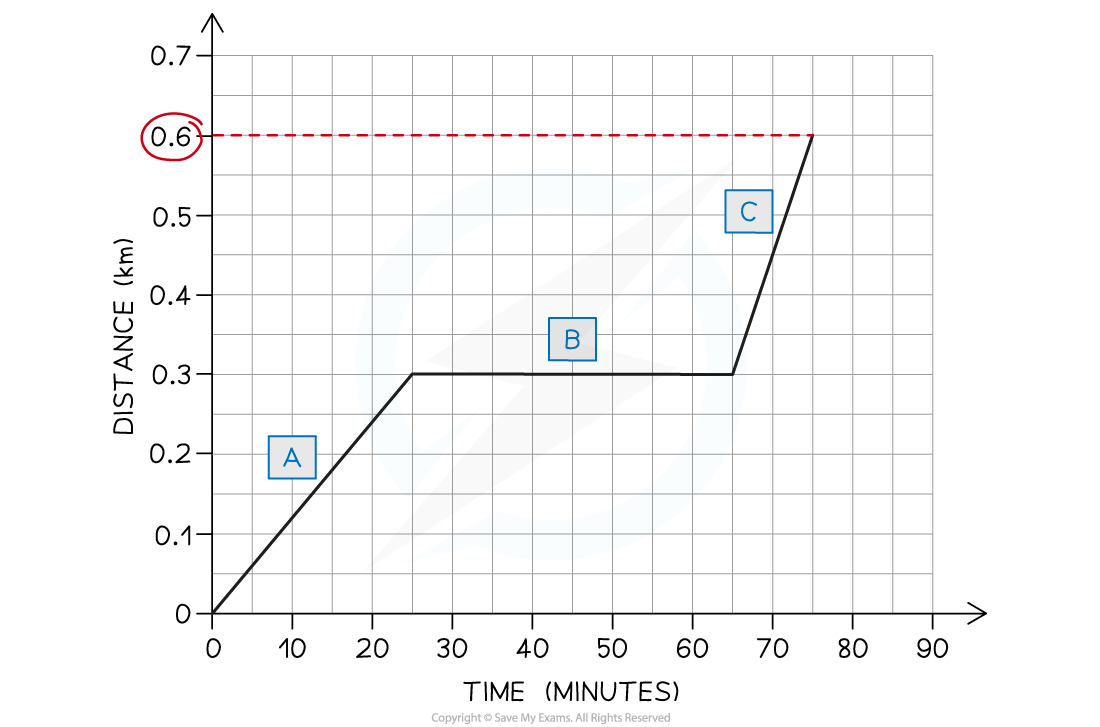
Ose decides to take a stroll to the park. He finds a bench in a quiet spot and takes a seat, picking up where he left off reading his book on Black Holes.After some time reading, Ose realises he lost track of time and runs home.A distance-time graph for his trip is drawn below: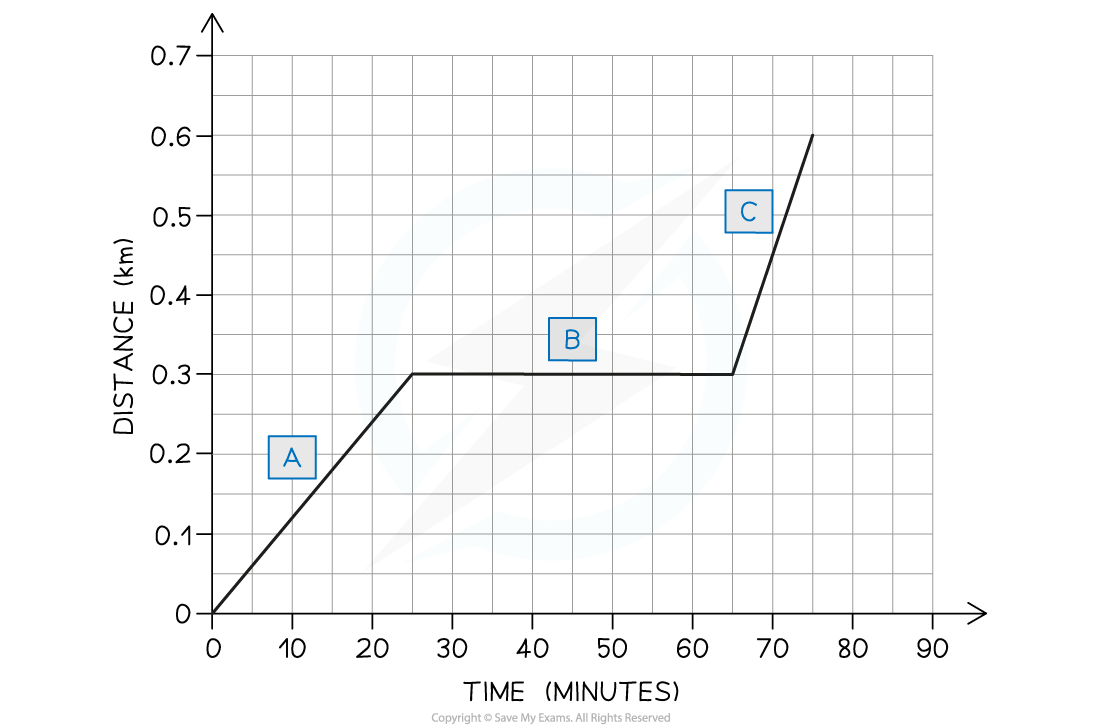 a) How long does Ose spend reading his book?There are three sections labelled on the graph: A, B and C.b) Which section represents Ose running home?
c) What is the total distance travelled by Ose?
Part (a)
-
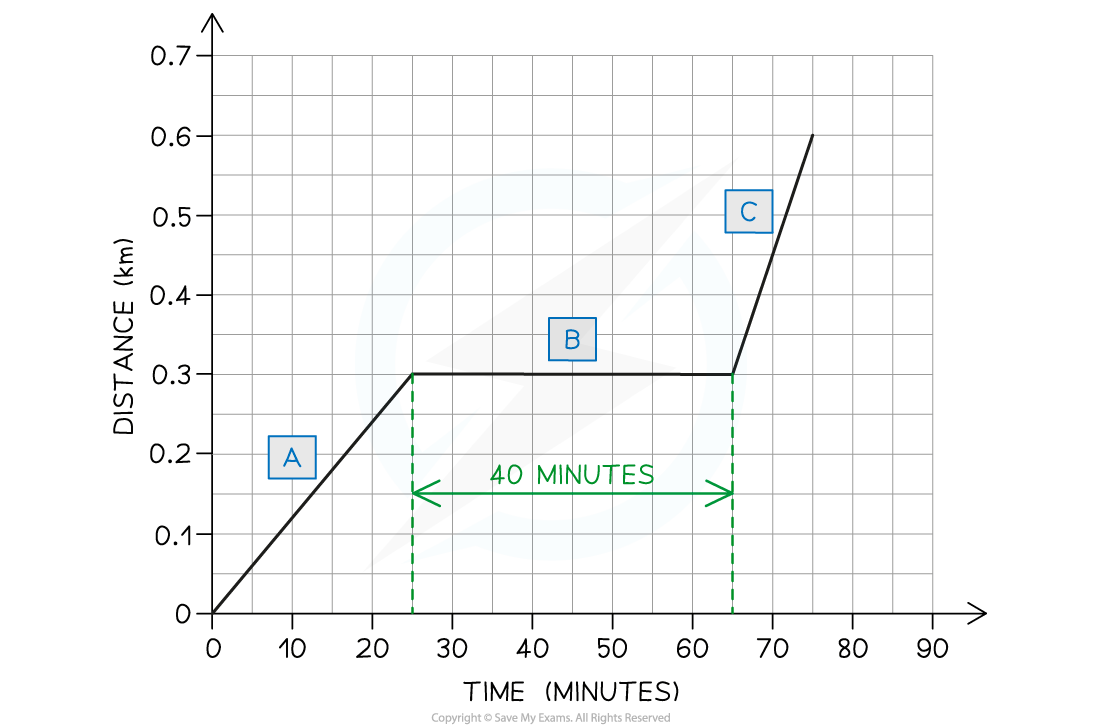
- Ose spends 40 minutes reading his book
- The flat section of the line (section B) represents an object which is stationary - so section B represents Ose sitting on the bench reading
- This section lasts for 40 minutes - as shown in the graph below
Part (b)
-
- Section C represents Ose running home
- The slope of the line in section C is steeper than the slope in section A
- This means Ose was moving with a larger speed (running) in section C
Part (c)
-
- The total distance travelled by Ose is 0.6 km
- The total distance travelled by an object is given by the final point on the line - in this case, the line ends at 0.6 km on the distance axis. This is shown in the image below:
Exam Tip
- Use the entire line, where possible, to calculate the gradient. Examiners tend to award credit if they see a large gradient triangle used - so remember to draw these directly on the graph itself!
- Remember to check the units of variables measured on each axis. These may not always be in standard units - in our example, the unit of distance was km and the unit of time was minutes. Double-check which units to use in your answer.
转载自savemyexam
以上就是关于【Edexcel IGCSE Physics 复习笔记 1.1.1 Distance-Time Graphs】的解答,如需了解学校/赛事/课程动态,可至翰林教育官网获取更多信息。
往期文章阅读推荐:
2027 Niche美国最佳大学排名发布!MIT蝉联第一、UCLA重夺“全美第一公立校”...
2025-26年CS Rankings计算机排名更新!上交/清华/浙大包揽前三,CMU第五!


翰林AMC8视频课重磅上线!

国际竞赛真题资源免费领取






