Edexcel IGCSE Physics 复习笔记 1.4.2 The Principle of Moments
Edexcel IGCSE Physics 复习笔记 1.4.2 The Principle of Moments The Principle of Moments The principle of moments states that: If an object is balanced, the total clockwise moment about...
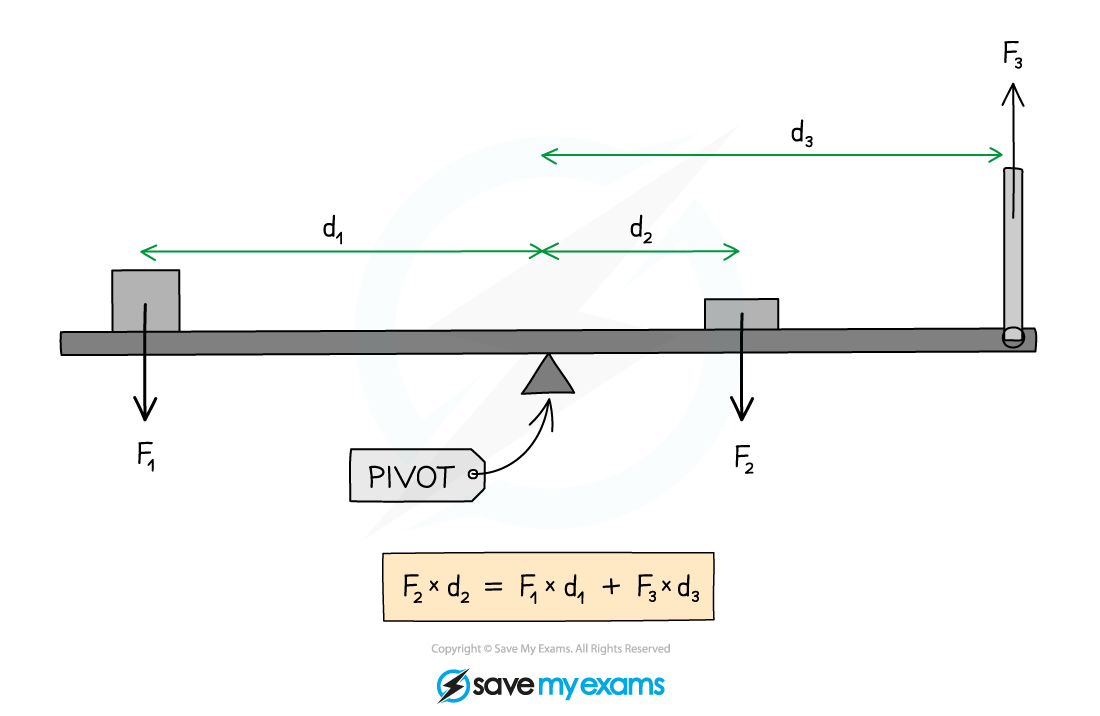
Edexcel IGCSE Physics 复习笔记 1.4.2 The Principle of Moments The Principle of Moments The principle of moments states that: If an object is balanced, the total clockwise moment about...
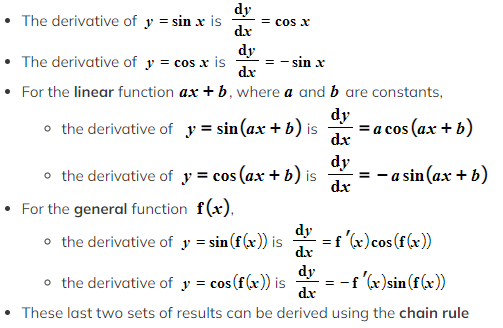
Differentiating Trig Functions How do I differentiate sin and cos? For calculus with trigonometric functions angles must be measured in radians Ensure you know how to change the angle mode on your ...
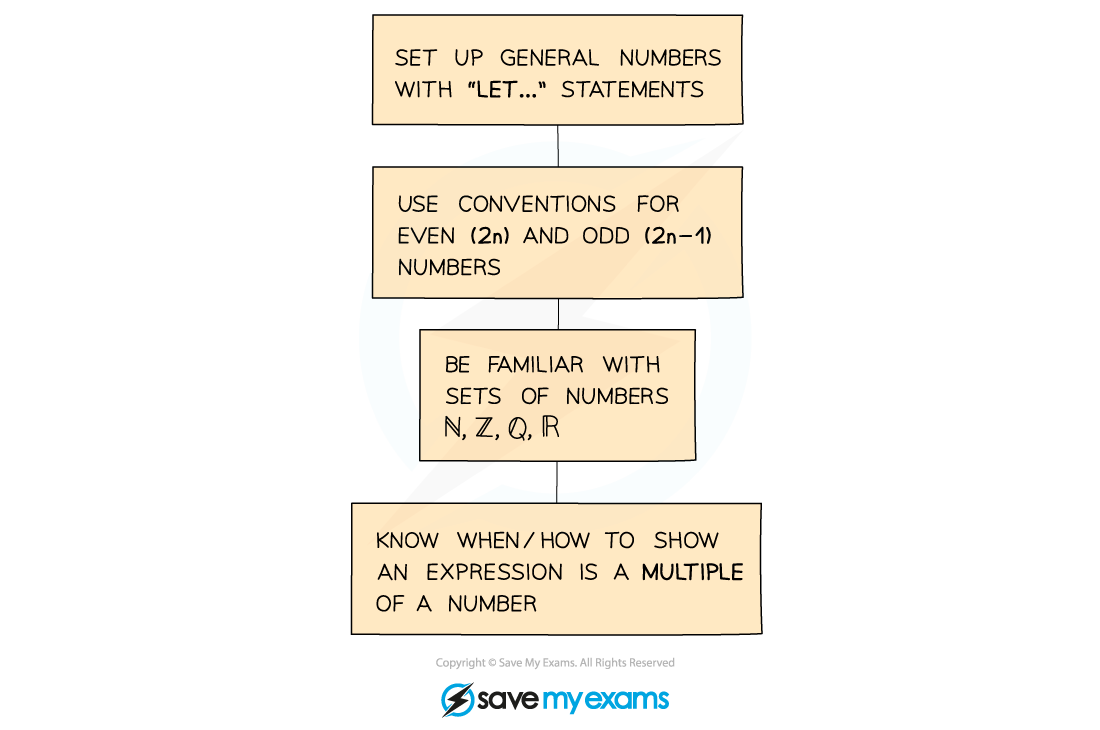
Proof by Deduction What is proof by deduction? Proof by deduction is when a mathematical and logical argument is used to shows whether or not a result is true How to do proof by deduction &n...
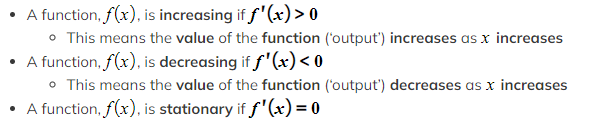
Increasing & Decreasing Functions What are increasing and decreasing functions? How do I find where functions are increasing, decreasing or stationary? To identify the intervals on which a func...
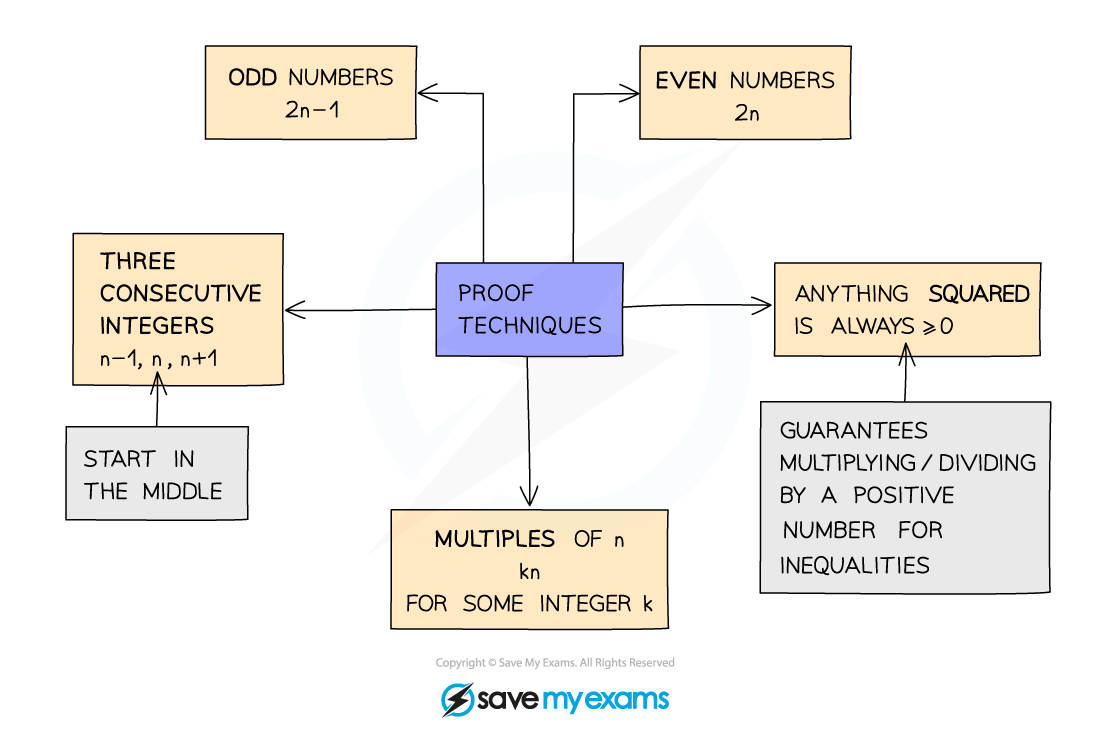
Language of Proof What is proof? Proof is a series of logical steps which show whether a result is true or not for a set of specified numbers e.g. All intigers, all even numbers etc Notation...
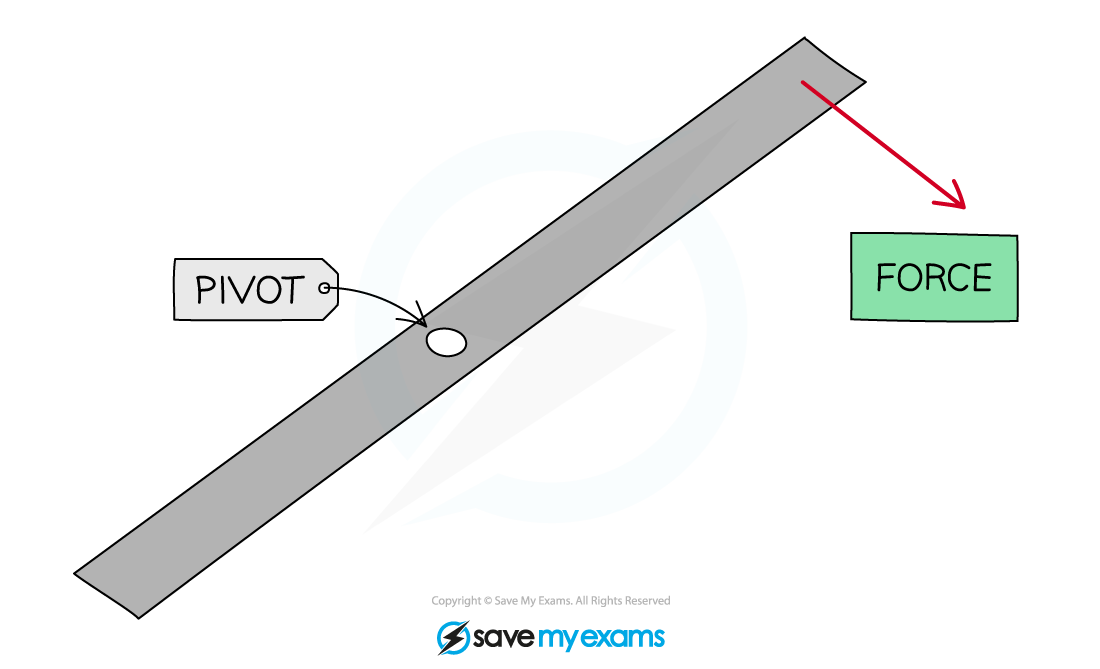
Edexcel IGCSE Physics 复习笔记 1.4.1 Moments The Moment of a Force As well as causing objects to speed up, slow down, change direction and deform, forces can also cause objects to rotate An ...
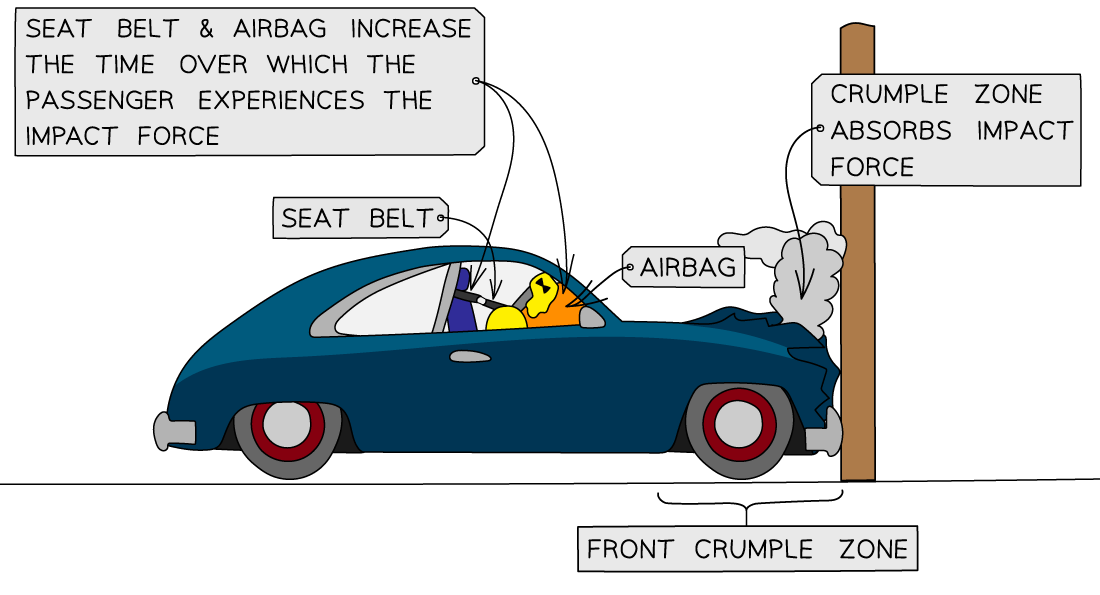
Edexcel IGCSE Physics 复习笔记 1.3.4 Momentum & Safety Features Momentum & Safety Features Since force is equal to the rate of change in momentum, the force of an impact in a vehicle...
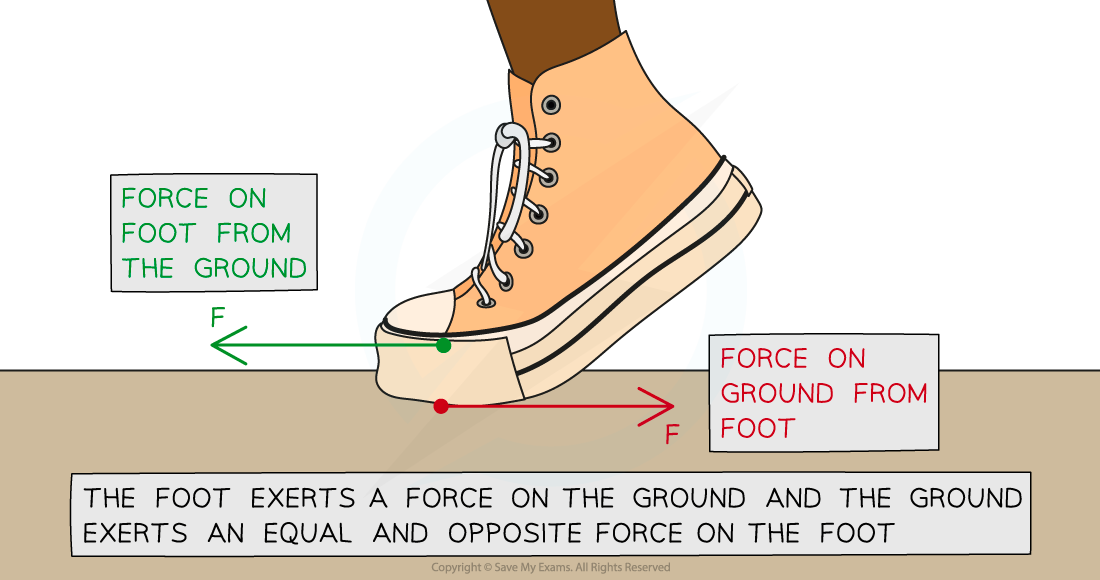
Edexcel IGCSE Physics 复习笔记 1.3.3 Newton's Third Law Newton's Third Law Newton's third law of motion states: Whenever two bodies interact, the forces they exert on each other are e...

Tilting What does it mean if a rod is on the point of tilting? A rod will tilt (rotate) about a pivot if the resultant moment about that pivot is non-zero Examples of tilting: A person walki...


