CIE A Level Biology复习笔记2.2.8 Phospholipids
The Vital Role of Phospholipids Structure Phospholipids are a type of lipid, therefore they are formed from the monomer glycerol and fatty acids Unlike triglycerides, there are only two fatty acids...
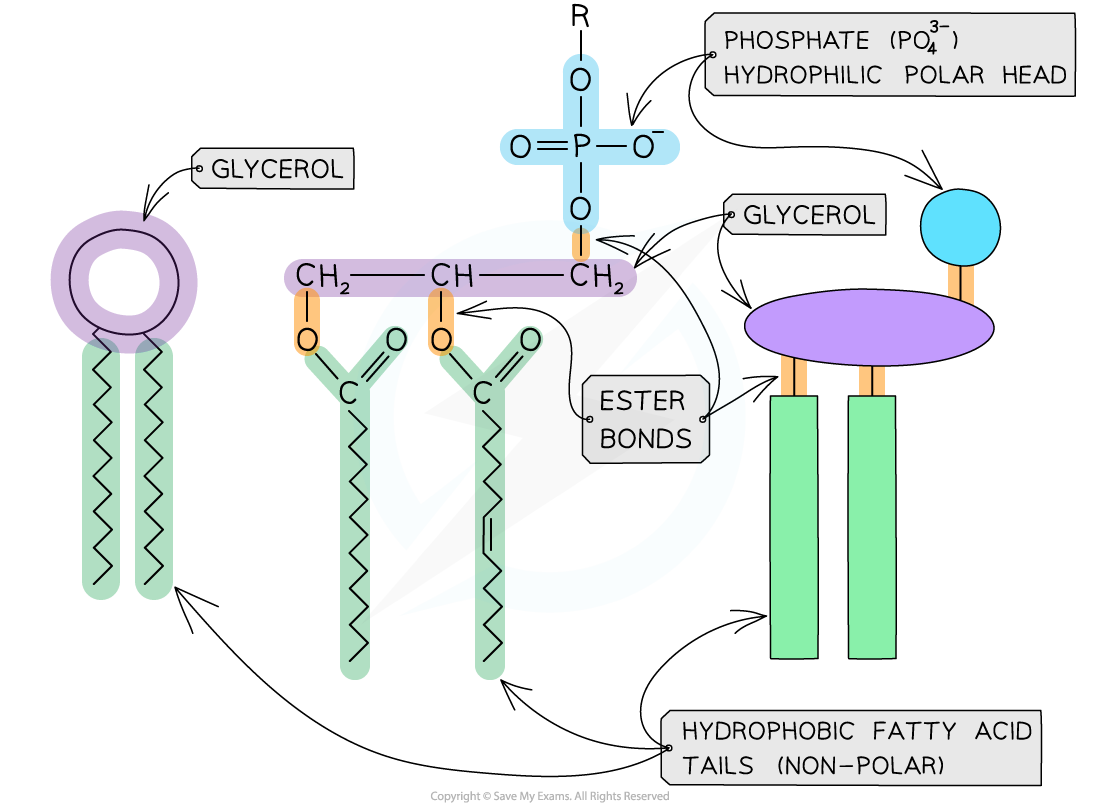
The Vital Role of Phospholipids Structure Phospholipids are a type of lipid, therefore they are formed from the monomer glycerol and fatty acids Unlike triglycerides, there are only two fatty acids...
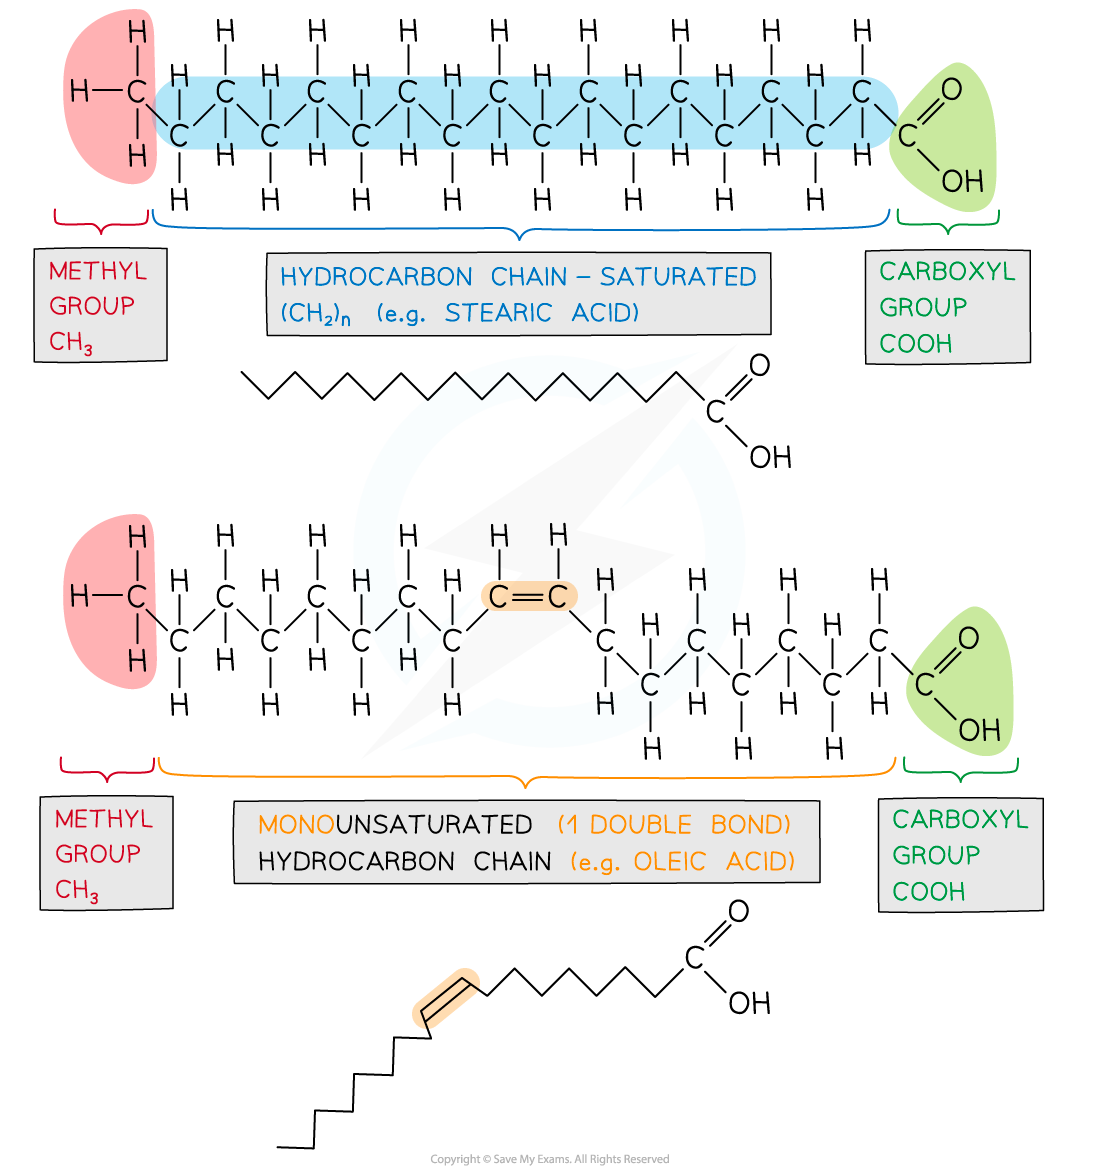
Triglycerides: Basics Lipids Macromolecules which contain carbon, hydrogen and oxygen atoms. However, unlike carbohydrates lipids contain a lower proportion of oxygen Non-polar and hydrophobic (ins...
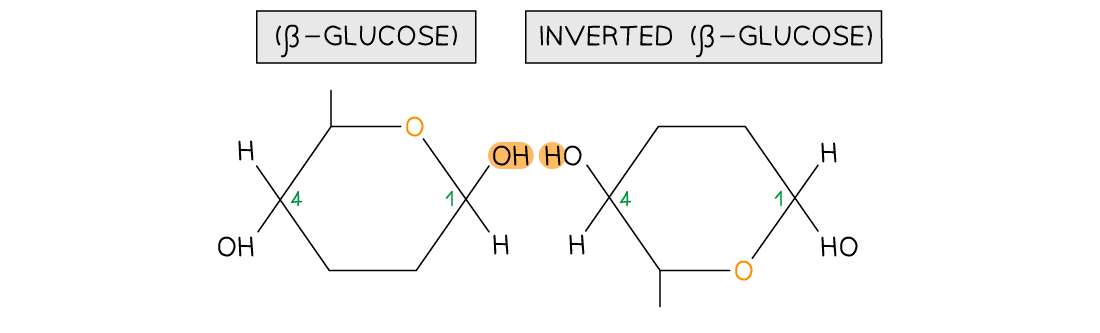
Cellulose: Structure & Function Cellulose is a polysaccharide Polysaccharides are macromolecules that are polymers formed by many monosaccharides joined by glycosidic bonds in a condensation re...
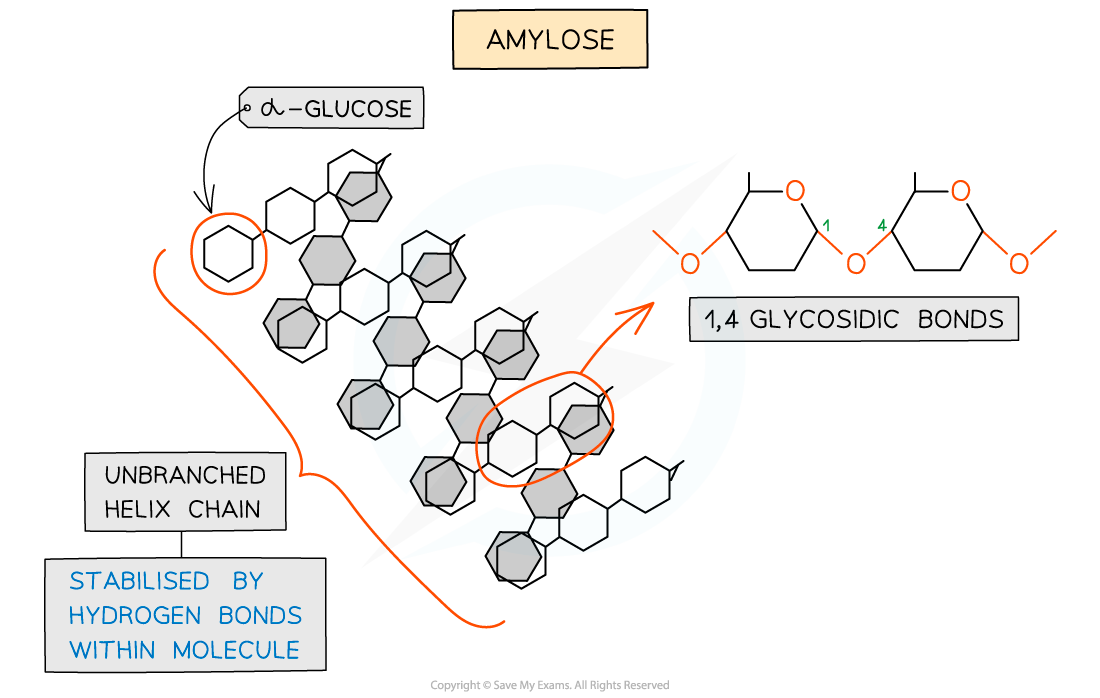
Starch & Glycogen: Structures & Functions Starch and glycogen are polysaccharides Polysaccharides are macromolecules that are polymers formed by many monosaccharides joined by glycosidic bo...
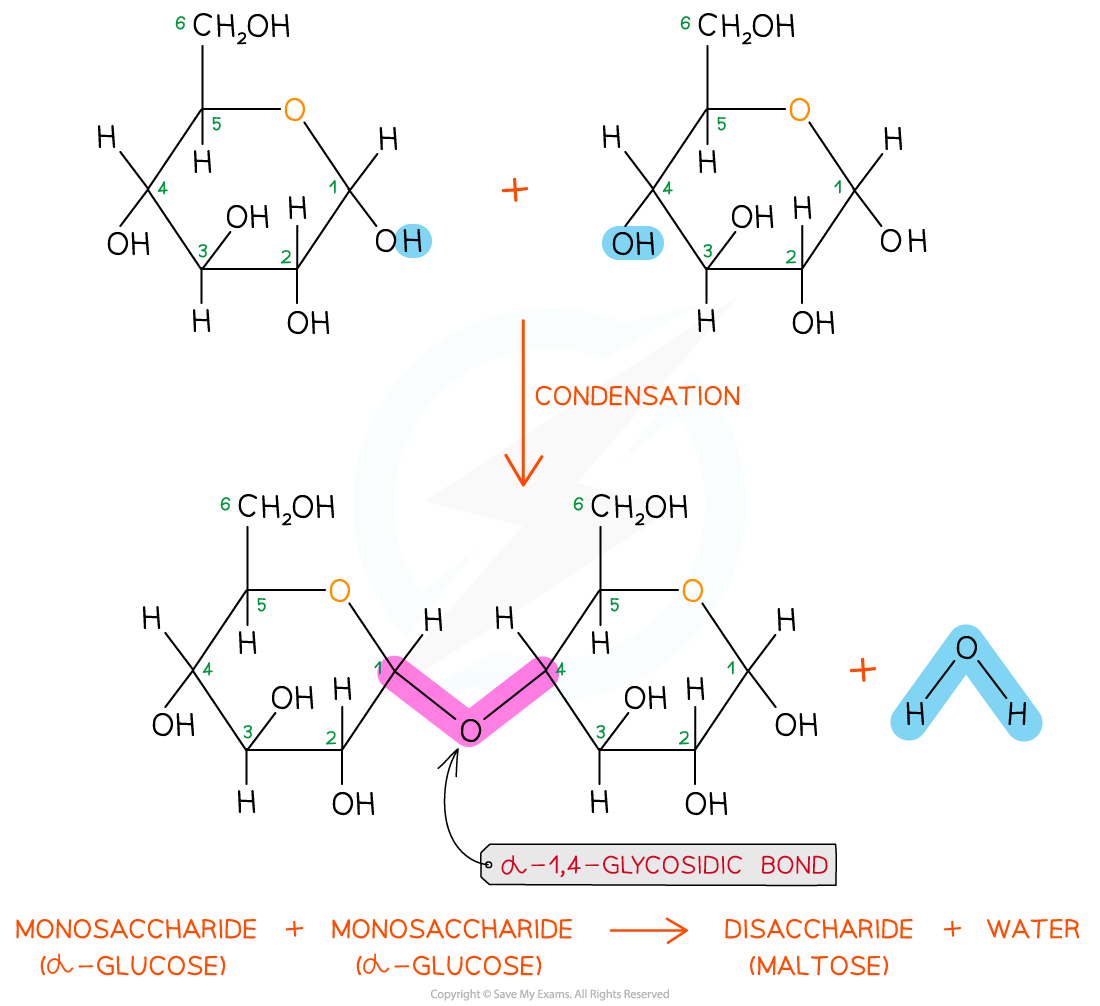
Forming the Glycosidic Bond To make monosaccharides more suitable for transport, storage and to have less influence on a cell’s osmolarity, they are bonded together to form disaccharides and polysa...

Reducing & Non-Reducing Sugars Sugars can be classified as reducing or non-reducing; this classification is dependent on their ability to donate electrons Reducing sugars can donate electrons (...
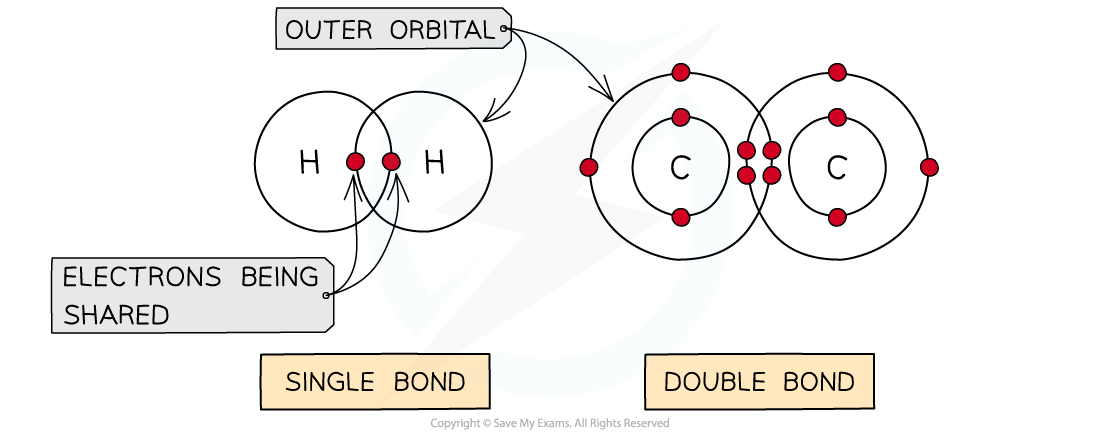
Covalent Bonds in Polymers A covalent bond is the sharing of two or more electrons between two atoms The electrons can be shared equally forming a nonpolar covalent bond or unequally (where an atom...
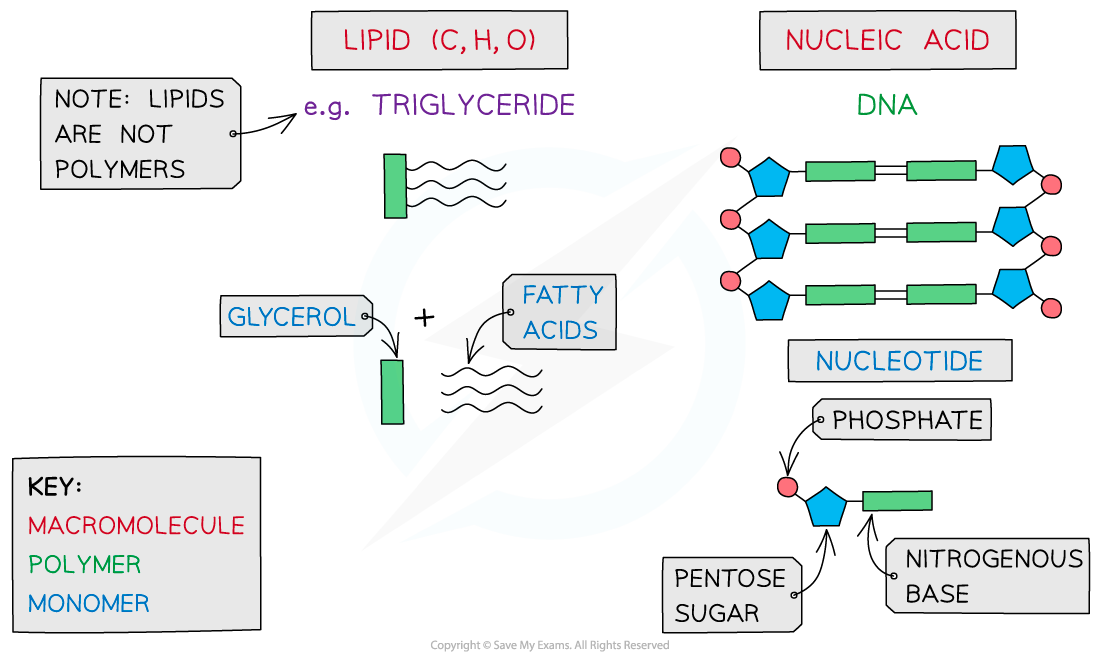
Biological Molecules: Key Terms The key molecules that are required to build structures that enable organisms to function are: Carbohydrates Proteins Lipids Nucleic Acids Water The key biological m...
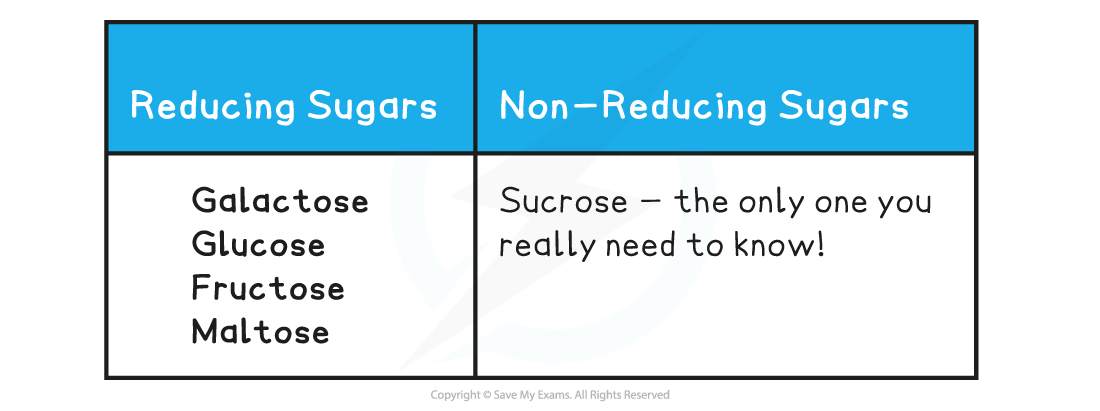
Testing for Non-Reducing Sugars Sugars can be classified as reducing or non-reducing; this classification is dependent on their ability to donate electrons (a reducing sugar that is able to donate ...


