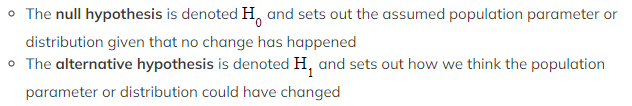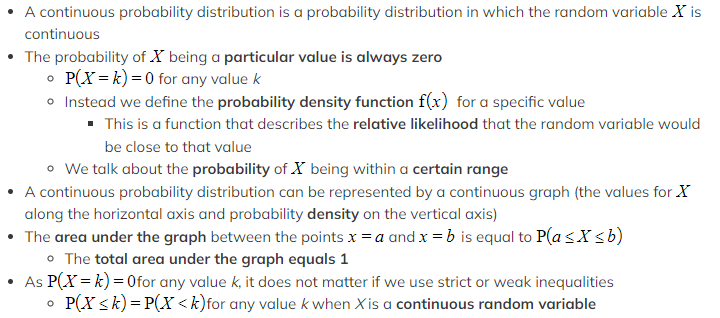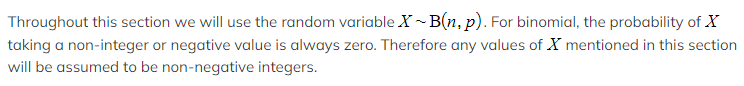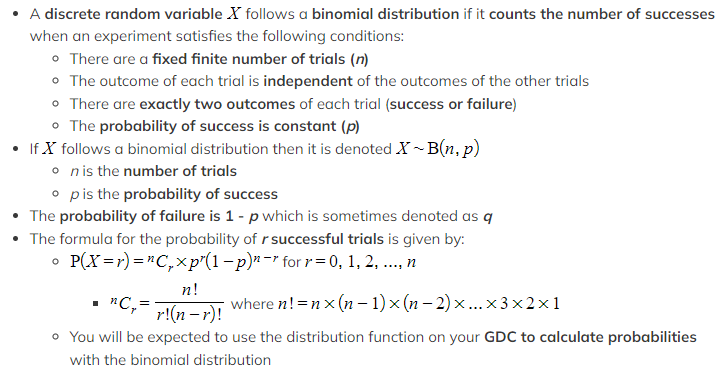
IB DP Maths: AI SL复习笔记4.7.2 Chi-squared Test for Independence
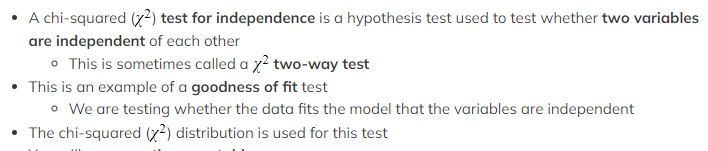
Chi-Squared Test for Independence What is a chi-squared test for independence? You will use a contingency table This is a two-way table that shows the observed frequencies for the different combina...