IB DP Maths: AI SL复习笔记4.3.3 Sample Space Diagrams

Venn Diagrams
What is a Venn diagram?
- A Venn diagram is a way to illustrate events from an experiment and are particularly useful when there is an overlap between possible outcomes
- A Venn diagram consists of
- a rectangle representing the sample space (U)
- The rectangle is labelled U
- Some mathematicians instead use S or ξ
- a circle for each event
- Circles may or may not overlap depending on which outcomes are shared between events
- a rectangle representing the sample space (U)
- The numbers in the circles represent either the frequency of that event or the probability of that event
- If the frequencies are used then they should add up to the total frequency
- If the probabilities are used then they should add up to 1
What do the different regions mean on a Venn diagram?
 Venn diagrams show ‘AND’ and ‘OR’ statements easily
- Venn diagrams also instantly show mutually exclusive events as these circles will not overlap
- Independent events can not be instantly seen
- You need to use probabilities to deduce if two events are independent
How do I solve probability problems involving Venn diagrams?
- Draw, or add to a given Venn diagram, filling in as many values as possible from the information provided in the question
- It is usually helpful to work from the centre outwards
- Fill in intersections (overlaps) first
-
 Add together the frequencies/probabilities in the B circle
- This is your denominator
- Out of those frequencies/probabilities add together the ones that are also in the A circle
- This is your numerator
- Evaluate the fraction
Exam Tip
- If you struggle to fill in a Venn diagram in an exam:
- Label the missing parts using algebra
- Form equations using known facts such as:
- the sum of the probabilities should be 1
- P(A∩B)=P(A)P(B) if A and B are independent events
Worked Example
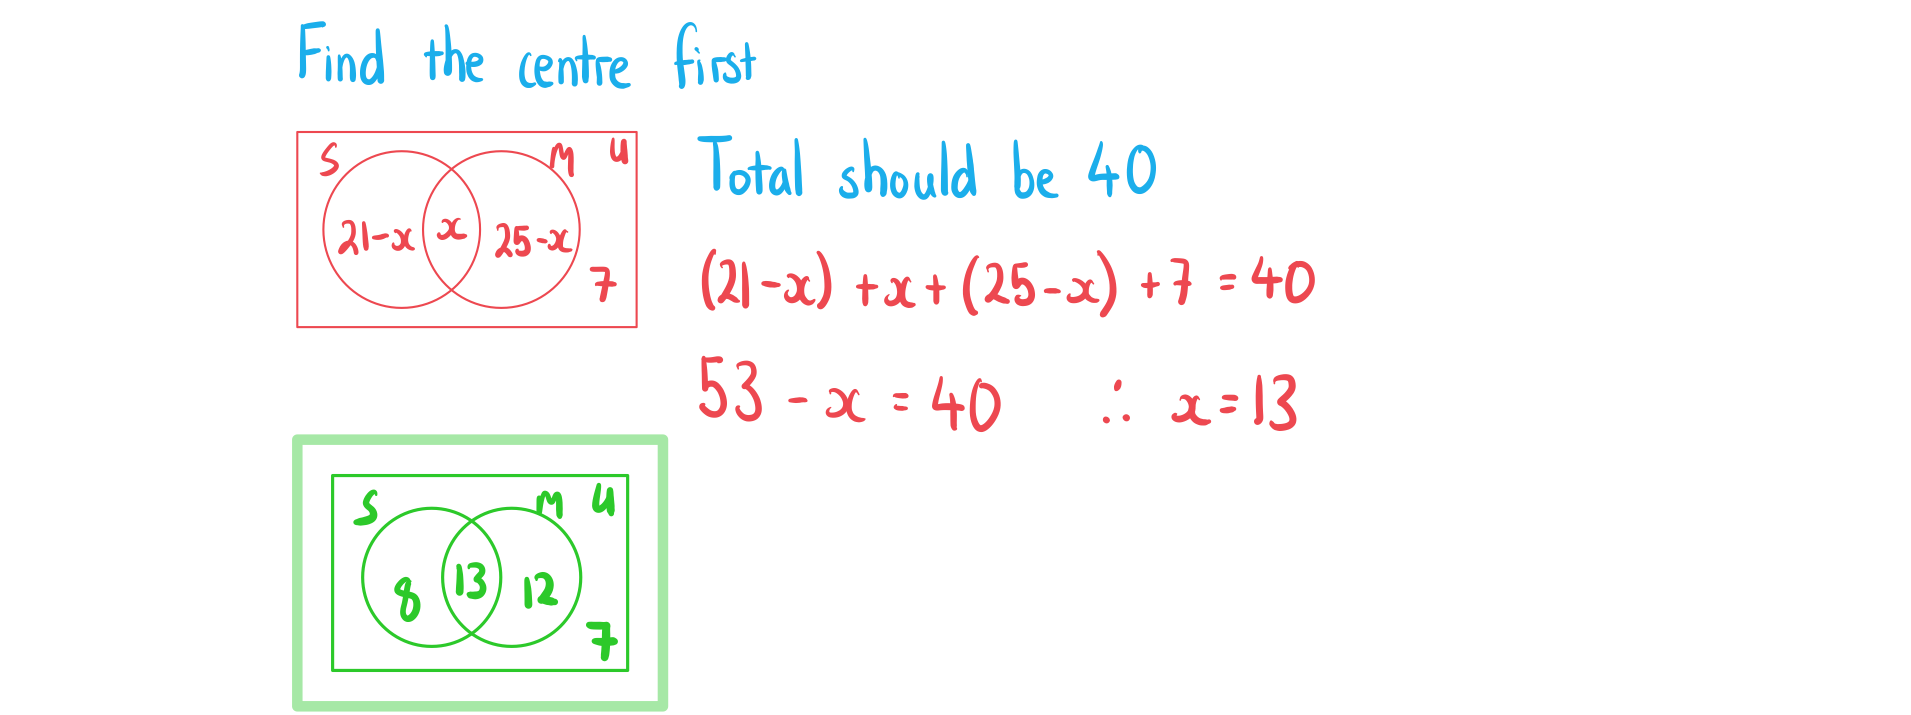
40 people are asked if they have sugar and/or milk in their coffee. 21 people have sugar, 25 people have milk and 7 people have neither.
a)Draw a Venn diagram to represent the information.
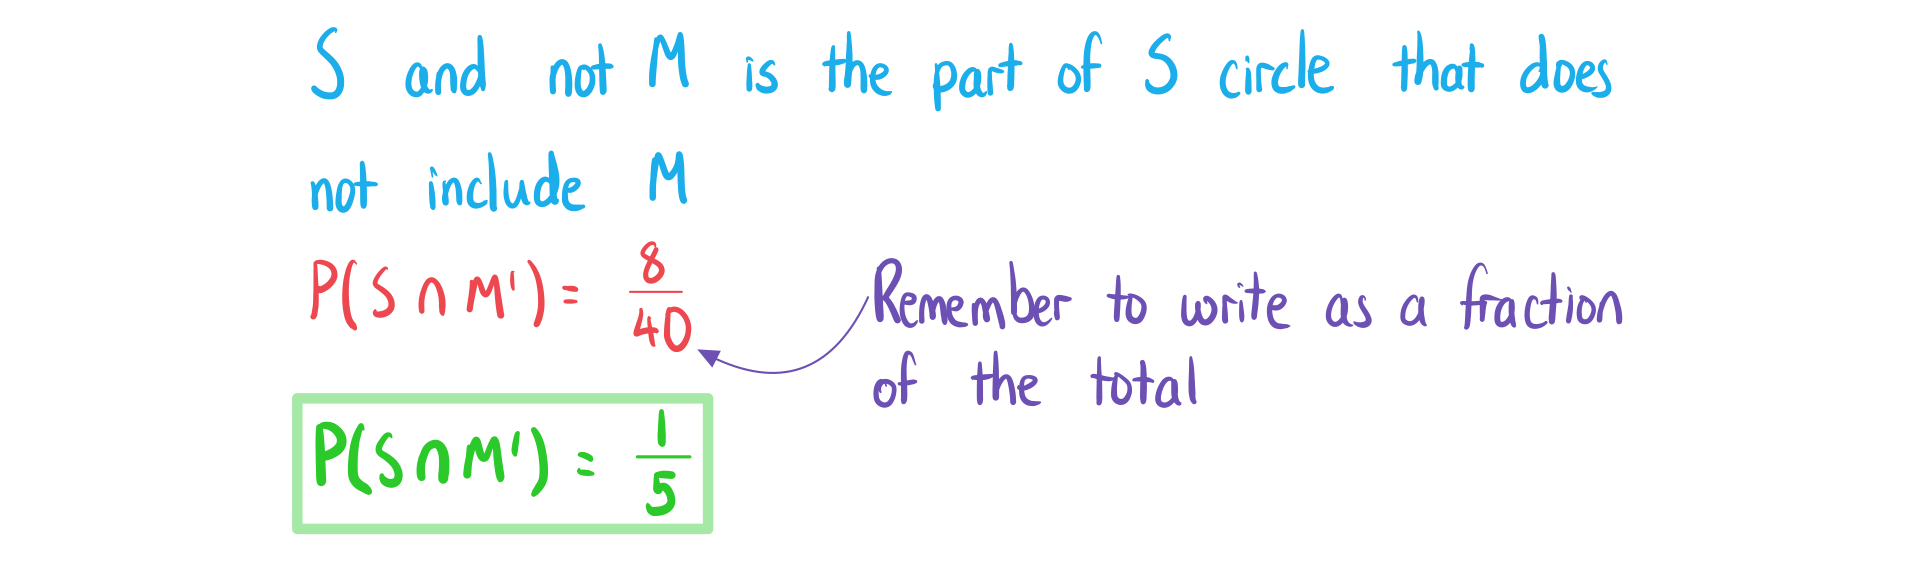
b)One of the 40 people are randomly selected, find the probability that they have sugar but not milk with their coffee.
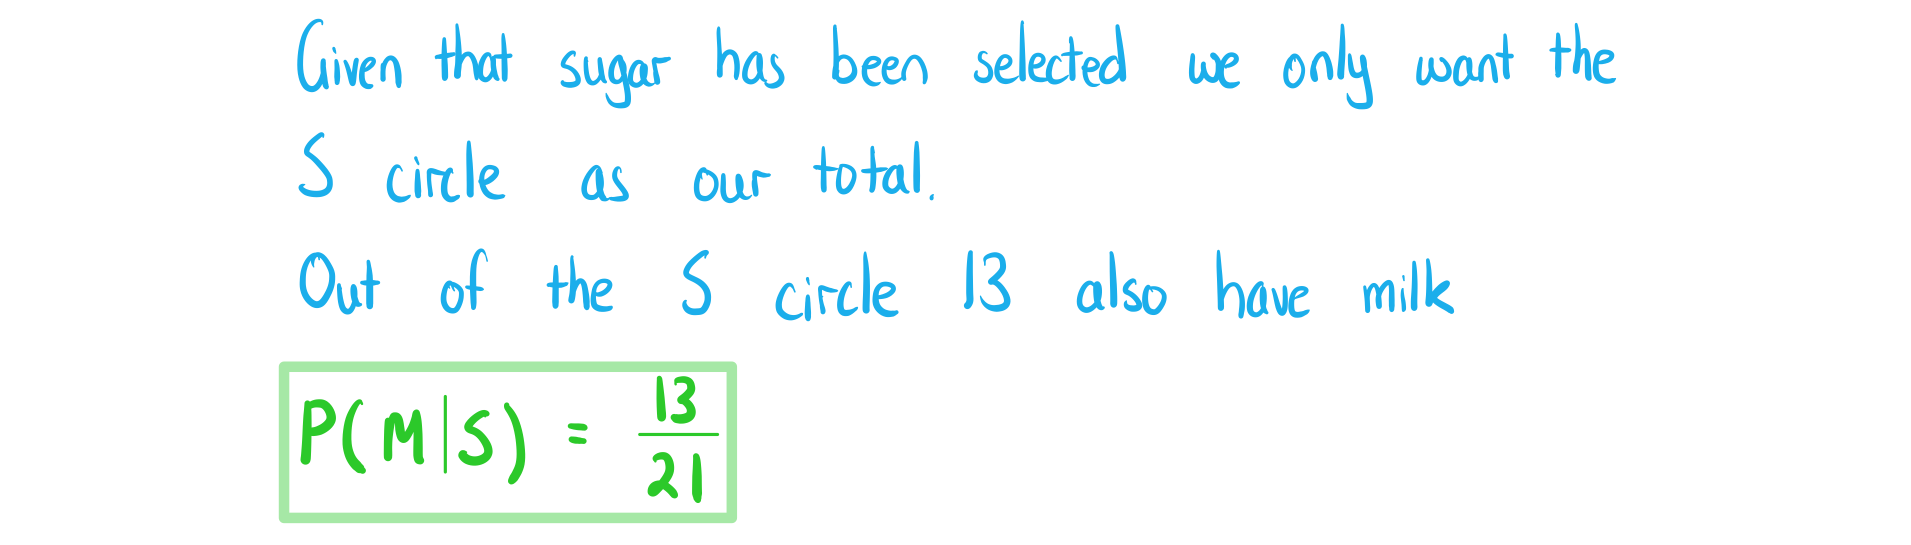
c)Given that a person who has sugar is selected at random, find the probability that they have milk with their coffee.
Tree Diagrams
What is a tree diagram?
- A tree diagram is another way to show the outcomes of combined events
- They are very useful for intersections of events
- The events on the branches must be mutually exclusive
- Usually they are an event and its complement
- The probabilities on the second sets of branches can depend on the outcome of the first event
- These are conditional probabilities
- When selecting the items from a bag:
- The second set of branches will be the same as the first if the items are replaced
- The second set of branches will be the different to the first if the items are not replaced
How are probabilities calculated using a tree diagram?
- To find the probability that two events happen together you multiply the corresponding probabilities on their branches
- It is helpful to find the probability of all combined outcomes once you have drawn the tree
- To find the probability of an event you can:
- add together the probabilities of the combined outcomes that are part of that event
 Do I have to use a tree diagram?
- add together the probabilities of the combined outcomes that are part of that event
- If there are multiple events or trials then a tree diagram can get big
- You can break down the problem by using the words AND/OR/NOT to help you find probabilities without a tree
- You can speed up the process by only drawing parts of the tree that you are interested in
Which events do I put on the first branch?
- If the events A and B are independent then the order does not matter
- If the events A and B are not independent then the order does matter
- If you have the probability of A given B then put B on the first set of branches
- If you have the probability of B given A then put A on the first set of branches
Exam Tip
- In an exam do not waste time drawing a full tree diagram for scenarios with lots of events unless the question asks you to
- Only draw the parts that you are interested in
Worked Example
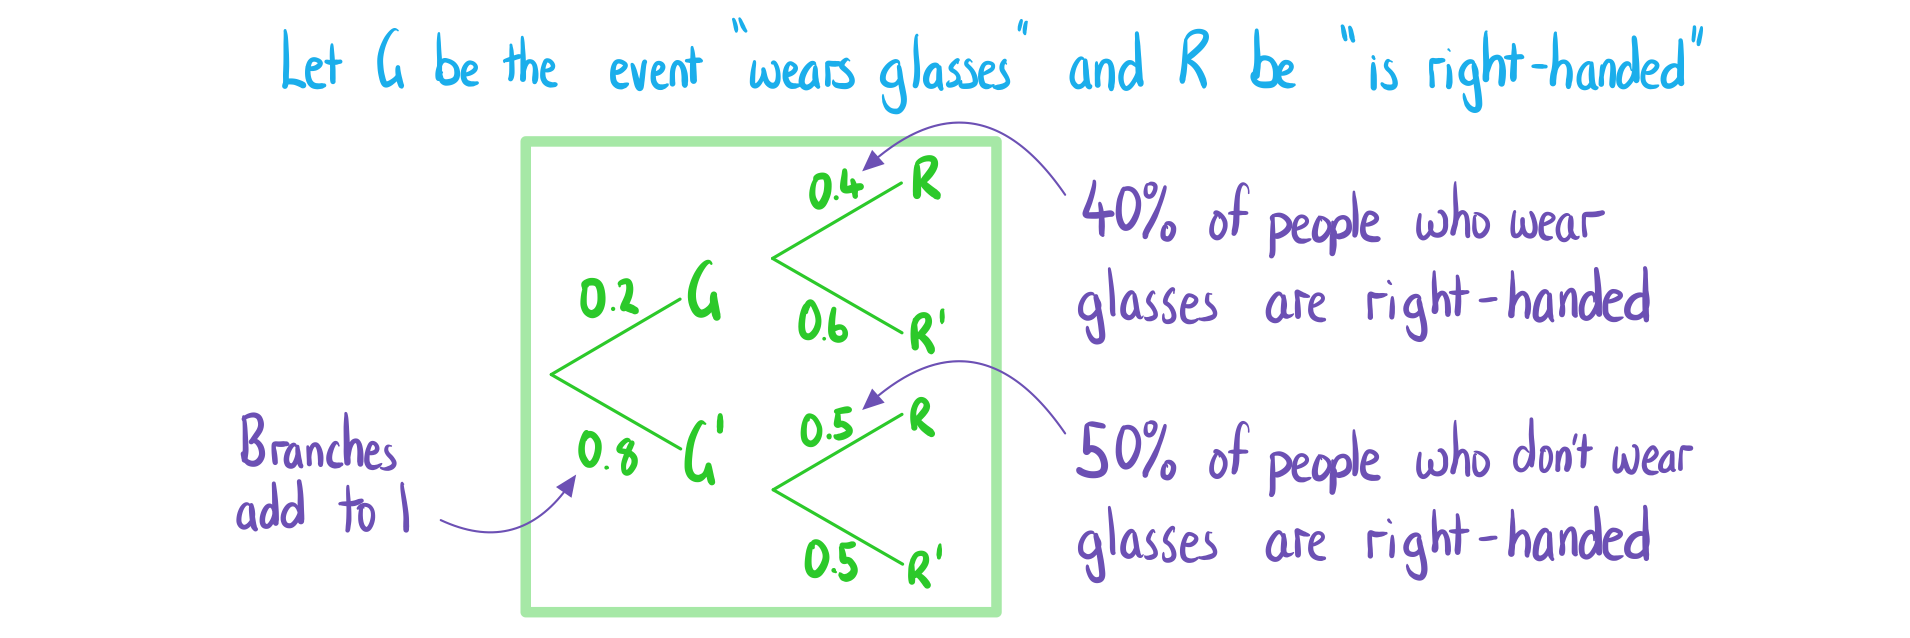
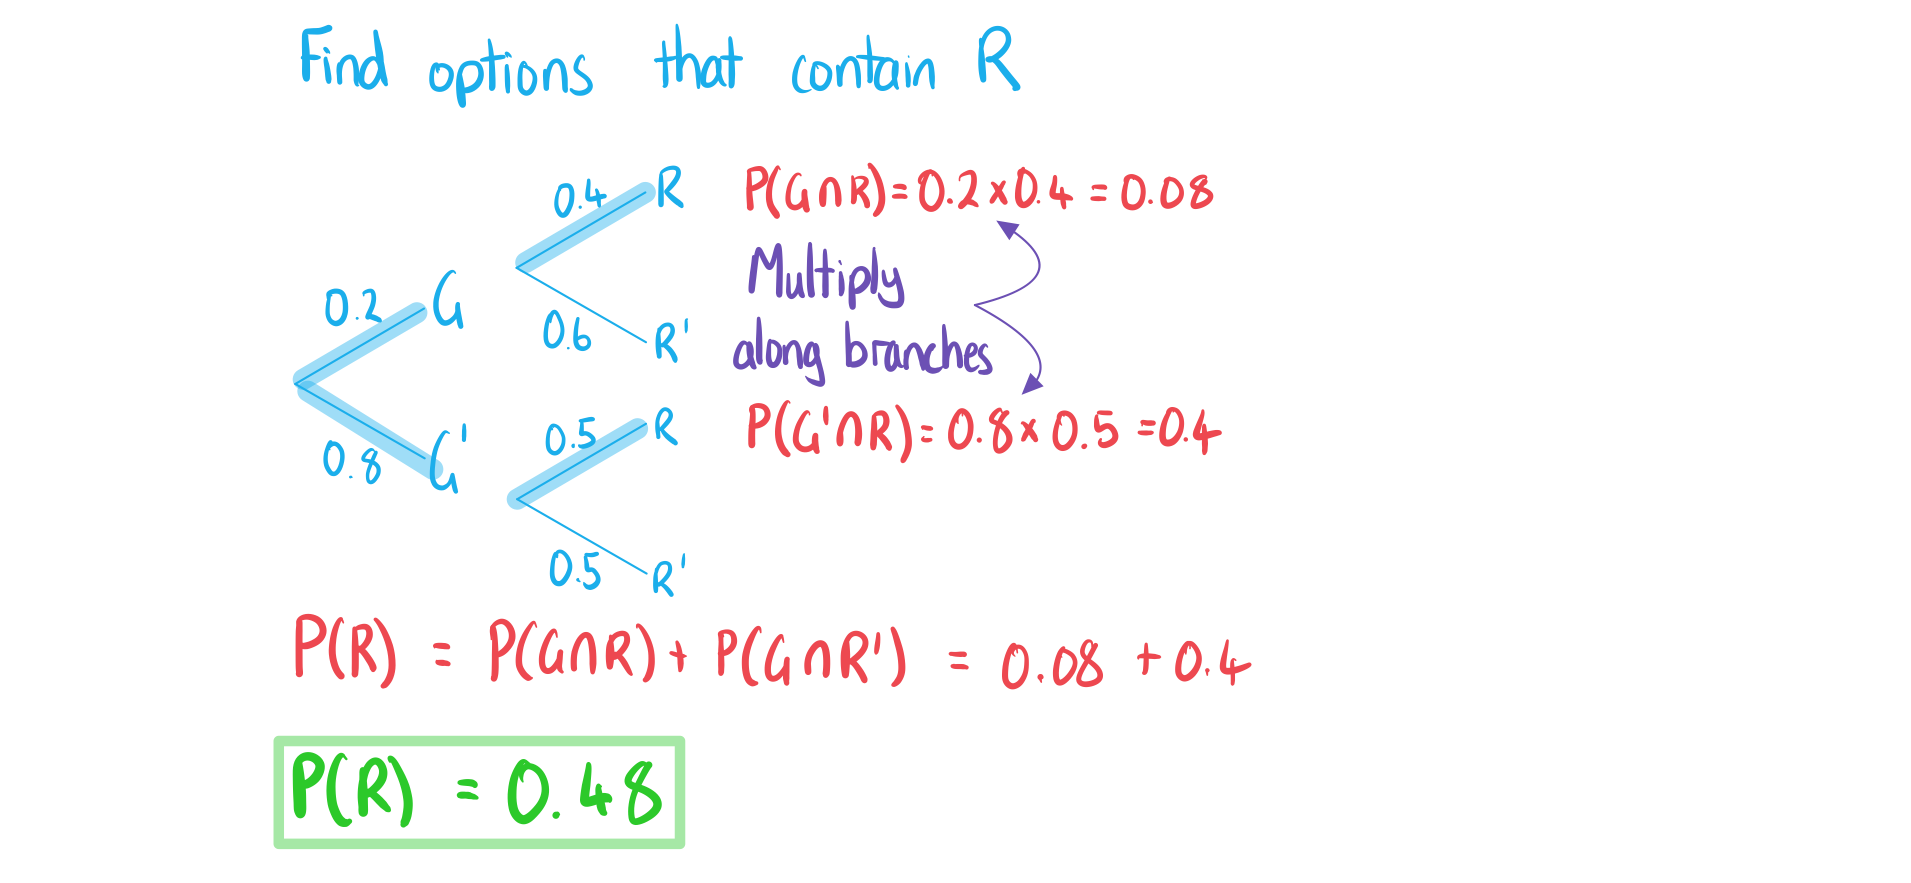
20% of people in a company wear glasses. 40% of people in the company who wear glasses are right-handed. 50% of people in the company who don’t wear glasses are right-handed.
a)Draw a tree diagram to represent the information.
b)One of the people in the company are randomly selected, find the probability that they are right-handed.
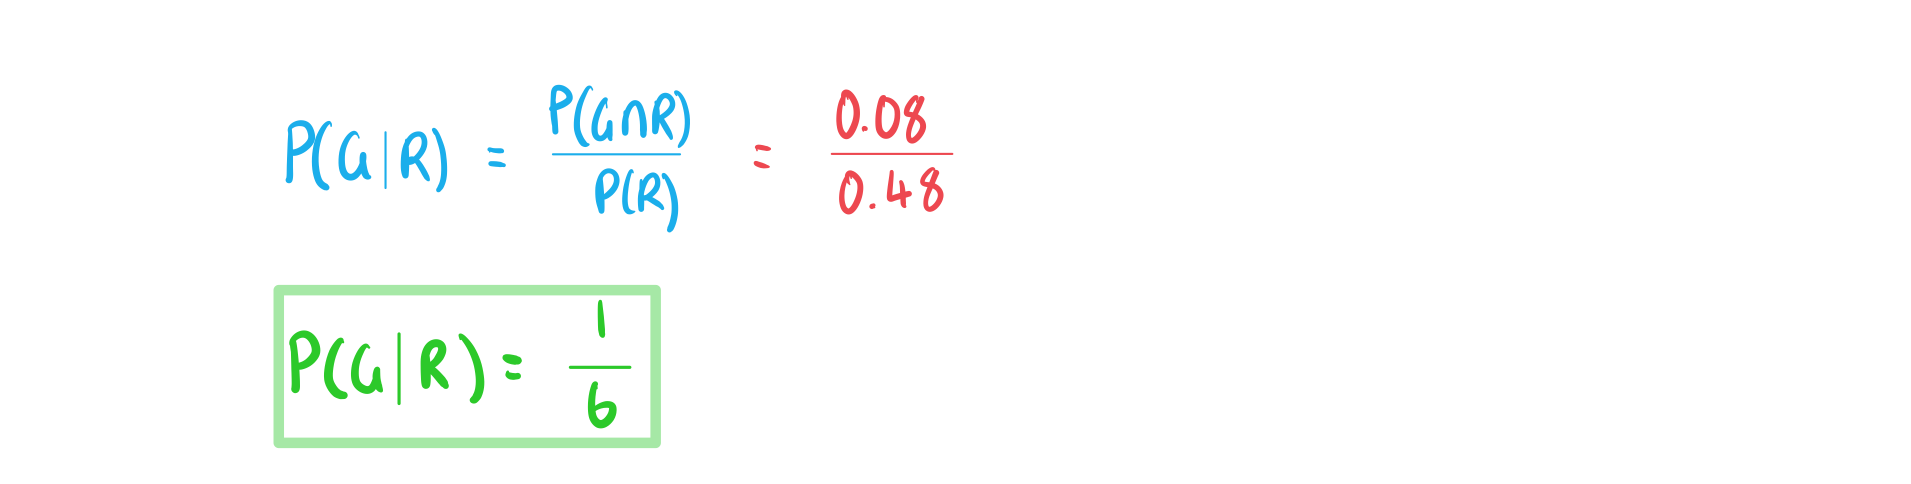
c)Given that a person who is right-handed is selected at random, find the probability that they wear glasses.
转载自savemyexams
以上就是关于【IB DP Maths: AI SL复习笔记4.3.3 Sample Space Diagrams】的解答,如需了解学校/赛事/课程动态,可至翰林教育官网获取更多信息。
往期文章阅读推荐:
翰林独家 | 经济学竞赛核心精讲,一册打通NEC/IEO/USAEBO!
2026 AMC10/12美国数学竞赛新赛季!【翰林教育 × 清华大学出版社】独家教材全面发售!


翰林AMC8视频课重磅上线!

国际竞赛真题资源免费领取






