Edexcel A (SNAB) A Level Biology:复习笔记1.2.10 Reducing Risk Factors of CVD

Lipids & CVD
- A risk factor is any factor that increases the chance of developing a particular condition or disease
- An increase in a risk factor does not guarantee the development of disease, but increases the risk
- An example of a risk factor for the incidence of CVD is increased blood cholesterol
- An increase in the presence of a risk factor would be expected to lead to increased incidence of disease
- The incidence of disease describes the number of cases of a disease that occur within a particular group of people within a given time
Cholesterol
- Cholesterol is a type of lipid produced in the body
- Cells require a source of cholesterol for cell membrane functioning, sex hormone structure, and the synthesis of bile
- Cholesterol is transported around the body as lipoproteins
- Lipoproteins are molecules composed of lipid and protein
- There are two types of lipoproteins; high density lipoproteins (HDLs) and low density lipoproteins (LDLs)
- The balance of HDLs and LDLs in the blood is thought to be an important factor in the risk of developing heart disease
High density lipoproteins
- HDLs contain unsaturated fat, cholesterol, and protein
- These moloecules transport cholesterol from body tissues to the liver to be recycled or excreted; they are responsible for reducing blood cholesterol levels when it is too high
- HDLs are also thought to contribute to the removal of cholesterol from the fatty plaques that form during atherosclerosis
Low density lipoproteins
- LDLs contain saturated fat, cholesterol, and protein
- The role of LDL is to move cholesterol from the liver into the bloodstream where it remains until it is required by the cells; they increase blood cholesterol levels when it is too low
- LDLs bind to receptors on cell surface membranes, enabling them to be taken up by the cells that need them and removing cholesterol from the blood
- High levels of LDLs can lead to blockage of these membrane receptors, causing blood cholesterol to rise
Lipoproteins and heart disease
- LDLs are often thought of as 'bad cholesterol'
- When your body has too much LDL cholesterol the membrane receptors on the surface of cells are blocked, leading to an overall rise in blood cholesterol
- Cholesterol contributes to the formation of plaques in the arteries
- High density lipoproteins are often thought of as 'good cholesterol'
- This is because HDLs carry cholesterol to the liver where it is broken down and excreted, therefore lowering overall blood cholesterol levels
- Rather than one being bad and the other good, in reality it is the ratio of LDLs to HDLs that is important; the healthy ratio is thought to be roughly 3:1 of LDL:HDL
- It is thought that an LDL:HDL ratio larger than 5:1 increases the risk of heart disease
- While diet is a factor in determining the production of LDLs and HDLs in the body, the way in which the cells process lipids is also thought to be important
- It is important to be able to analyse data on the link between lipoproteins and CVD
Evaluating data linked to risk factors
- There are several things that should be taken into consideration when analysing data from studies on health risk factors; if, for example, a study is conducted on the effects of smoking on lung health, then the following should be kept in mind
- Sample size; a study with a large sample size will give results that are more likely to be representative of the target population
- Individuals in the sample; the results of a study can only be applied to parts of the population represented in the sample, e.g.
- If the sample only contains women aged 20-40 then the results cannot be used to draw conclusions about the effect of smoking on males or older women
- Control group; a study of this nature needs to contain a control group so that the effects of the variable of interest can be isolated from the effects of other factors
- In this example the control group would contain individuals who do not smoke; this gives a base line against which the results from the smoker group can be compared
- All factors other than the variable of interest should be controlled between the control group and the test group, e.g. age, diet, activity levels
- Statistical significance; the differences between groups need to be sufficiently large to be sure that they are not just the result of random chance; this is known as being statistically significant
- To determine whether a difference between results is significantly different, statistical analysis needs to be carried out
- Statistical significance can often be determined by comparing standard deviations of two data sets
- If standard deviations overlap then the difference between data sets is not statistically significant
- If the standard deviations do not overlap then the difference is statistically significant
- The influence of other variables; variables other than the variable of interest need to be controlled so that they do not impact the results; in this study such control variables might include
- Genetics
- Secondary exposure to smoking
- Exercise levels
- Diet
Worked Example
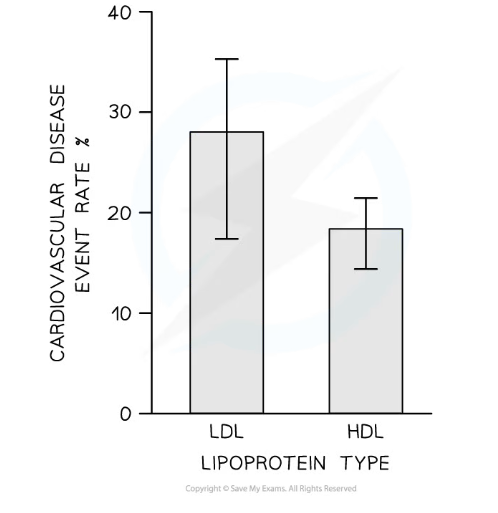
The graph below shows different lipoproteins with their associated cardiovascular disease rate. Note that the bars represent the standard deviations of the data sets.
The study involved 300 men aged between 40 and 80. Their LDL and HDL levels were measured over a period of 30 weeks and mapped against developing CVD events such as atheromas and thrombosis
- Describe the data
- Draw a conclusion
- Comment on the validity of the data. Note that validity refers to a study that successfully measures the variable that it sets out to measure, without influence from any other factors.
1. Describe the data
The graph shows that the cardiovascular event rate percentage is higher with LDLs compared to HDLs
The cardiovascular event rate with LDLs is around 28 % while the event rate percentage for HDLs is around 18 %
2. Draw a conclusion
There is no significant difference in percentage of CVD events with LDL and HDL as there is an overlap of the standard deviation bars
3. Comment on the validity of the data
A sample of 300 men is very small in relation to an entire population, so needs to be larger in order to be representative
Only men between 40 and 80 were sampled, so the data is not representative of the entire population
Other factors relating to CVD are not measured or commented on, e.g. smoking, diet, exercise; such factors would need to be controlled between the two groups or measured so that their effect can be eliminated from the data
Evidence linking blood cholesterol to CVD
- High cholesterol is listed as one of the five main risk factors for heart disease by many research studies and organisations such as the British Heart Foundation and the NHS
- There is evidence of a correlation between high blood cholesterol levels and an increased risk of CVD
- Medical treatments such as statins, which reduce blood cholesterol levels also reduce risk of heart disease
- Diets high in saturated fats, which tends to raise LDL cholesterol levels in the blood, have been linked to increased CVD events
- A significant reduction in total blood cholesterol levels is linked to a decrease in major coronary events
- Arterial plaque regression has been observed alongside blood lipid-lowering therapy, which has led to a reduction in major cardiovascular events
- Note that when considering scientific evidence it is essential to remember that correlation is not the same as causation; a connection between two events, e.g. a diet high in saturated fat and raised LDL cholesterol, may not mean that one has caused the other
- It may be that there is a third variable that has not been measured that is influencing levels of LDL cholesterol, e.g. the presence of alleles that influence the way in which cells metabolise dietary fats
Exam Tip
When dealing with data there are a few important things to remember
- It is always a good idea to include numbers when you are describing a data set
- Correlation is not causation; when drawing conclusions it is always best to say 'there is a correlation' or 'there is an association' between two variables rather than stating that one has caused the other
- Look for clues about the validity of the experiment. Is the sample representative? Have other variables been controlled? Has statistical analysis been carried out?
Reducing Risk Factors of CVD
Diet
- Some scientific studies have linked a diet high in saturated fats to an increased risk of CVD
- It is worth noting that there are other studies that are inconclusive on the link between dietary saturated fat and CVD risk
- Studies that investigate the connection between diet and CVD can be used to educate members of the public on their consumption of certain foods
- Food labels now exist on most food packaging making consumers aware of what they are eating
- Traffic light warning labels (Red = high, Orange = medium, Green = low) also exist on many food labels to warn consumers of high levels of sugar, saturated fat, and salt
- People are able to make informed choices about their diets
- Obesity has been linked to an increase in CVD events
- Healthcare professionals can use a number of measures to identify obesity in patients
- Waste-to-hip ratio is the circumference of the waist in cm divided by the circumference of the hips in cm
- For women the ratio should be less than 0.86
- For men the ratio should be less than 1.0
- BMI is a value derived from dividing an individual's mass in kg by the square of their height (m2)
- A BMI of less than 18.5 indicates that the person is underweight
- 18.5 - 24.9 is considered normal
- 25 - 29.9 is considered overweight
- A person with a BMI of 30 or higher is considered obese
- Waste-to-hip ratio is the circumference of the waist in cm divided by the circumference of the hips in cm
- Obese individuals can make lifestyle choices to reduce their weight to a healthy range
Smoking
- Smoking has been linked to CVD by many research studies
- The research has led to changes in the way cigarettes are advertised
- Health warnings now exist on all packets
- TV and media portray smoking as an unhealthy lifestyle choice
- Free materials, including prescriptions, are available to support individuals to stop smoking
Exercise
- Inactivity has been linked to increased risk of CVD
- There are many campaigns and initiatives to encourage all people to partake in more exercise
- Increased hours of physical education in schools
- Targeted encouragement at different groups of people, such as teenagers
转载自savemyexams
以上就是关于【Edexcel A (SNAB) A Level Biology:复习笔记1.2.10 Reducing Risk Factors of CVD】的解答,如需了解学校/赛事/课程动态,可至翰林教育官网获取更多信息。
往期文章阅读推荐:
全网破防!ALevel CIE数学M1疑似错题?经济P2难度飙升?5月6日大考考情分析必看!
A-Level CIE就大规模泄题发布最严处罚!哪些考生必须重考?你的成绩怎么办?


翰林AMC8视频课重磅上线!

国际竞赛真题资源免费领取


