Edexcel A (SNAB) A Level Biology:复习笔记1.1.5 Cardiac Cycle

Cardiac Cycle
- The cardiac cycle is the series of events that take place in one heart beat, including muscle contraction and relaxation
- The contraction of the heart is called systole, while the relaxation of the heart is called diastole
- One cardiac cycle is followed by another in a continuous process
- There is no gap between cycles where blood stops flowing
Volume and pressure changes
- Contraction of the heart muscle causes a decrease in volume in the corresponding chamber of the heart, which then increases again when the muscle relaxes
- Volume changes lead to corresponding pressure changes
- When volume decreases, pressure increases
- When volume increases, pressure decreases
- Throughout the cardiac cycle, heart valves open and close as a result of pressure changes in different regions of the heart
- Valves open when the pressure of blood behind them is greater than the pressure in front of them
- They close when the pressure of blood in front of them is greater than the pressure behind them
- Valves are an important mechanism to stop blood flowing backwards
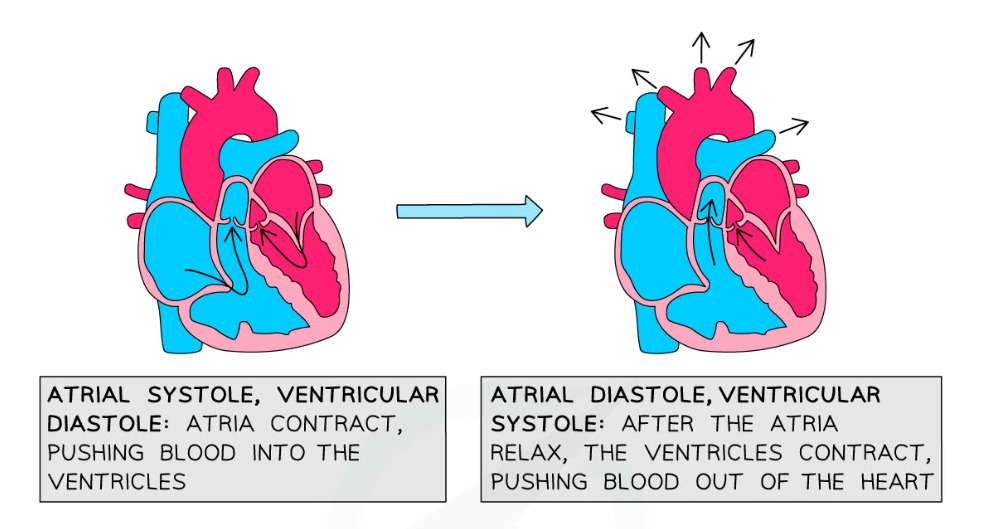
Atrial systole
- The walls of the atria contract
- Atrial volume decreases
- Atrial pressure increases
- The pressure in the atria rises above that in the ventricles, forcing the atrioventricular (AV) valves open
- Blood is forced into the ventricles
- There is a slight increase in ventricular pressure and chamber volume as the ventricles receive the blood from the atria
- The ventricles are relaxed at this point; ventricular diastole coincides with atrial systole
Ventricular systole
- The walls of the ventricles contract
- Ventricular volume decreases
- Ventricular pressure increases
- The pressure in the ventricles rises above that in the atria
- This forces the AV valves to close, preventing back flow of blood
- The pressure in the ventricles rises above that in the aorta and pulmonary artery
- This forces the semilunar (SL) valves open so blood is forced into the arteries and out of the heart
- During this period, the atria are relaxing; atrial diastole coincides with ventricular systole
- The blood flow to the heart continues, so the relaxed atria begin to fill with blood again
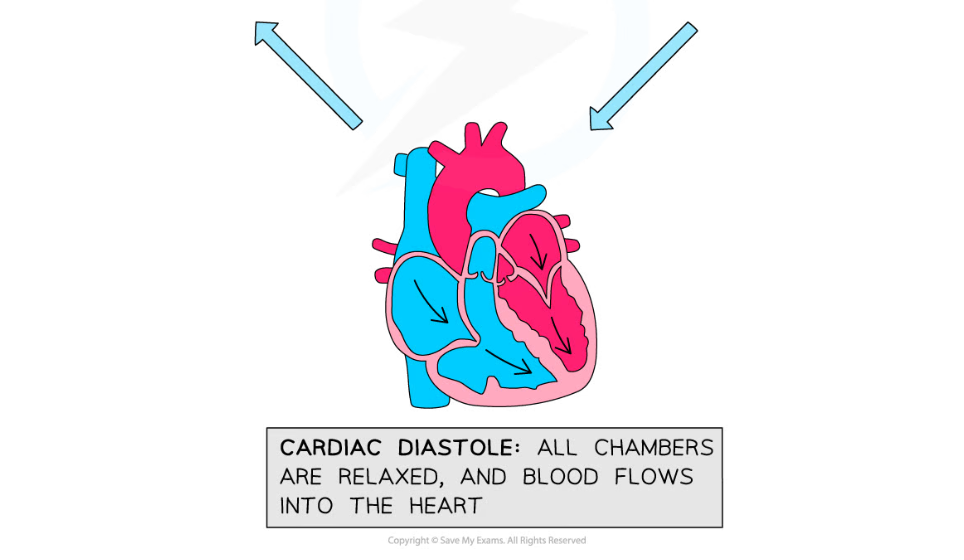
Diastole
- The ventricles and atria are both relaxed
- The pressure in the ventricles drops below that in the aorta and pulmonary artery, forcing the SL valves to close
- The atria continue to fill with blood
- Blood returns to the heart via the vena cava and pulmonary vein
- Pressure in the atria rises above that in the ventricles, forcing the AV valves open
- Blood flows passively into the ventricles without need of atrial systole
- The cycle then begins again with atrial systole
The events of the cardiac cycle allow the heart to pump blood to the lungs and body
Pressure Changes in the Heart Table
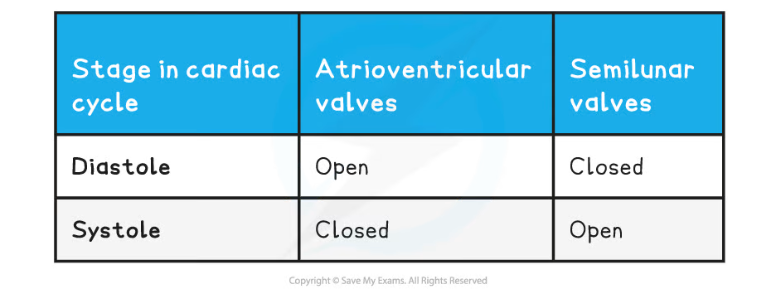
Pressure changes in the heart during the cardiac cycle cause the valves of the heart to open and close
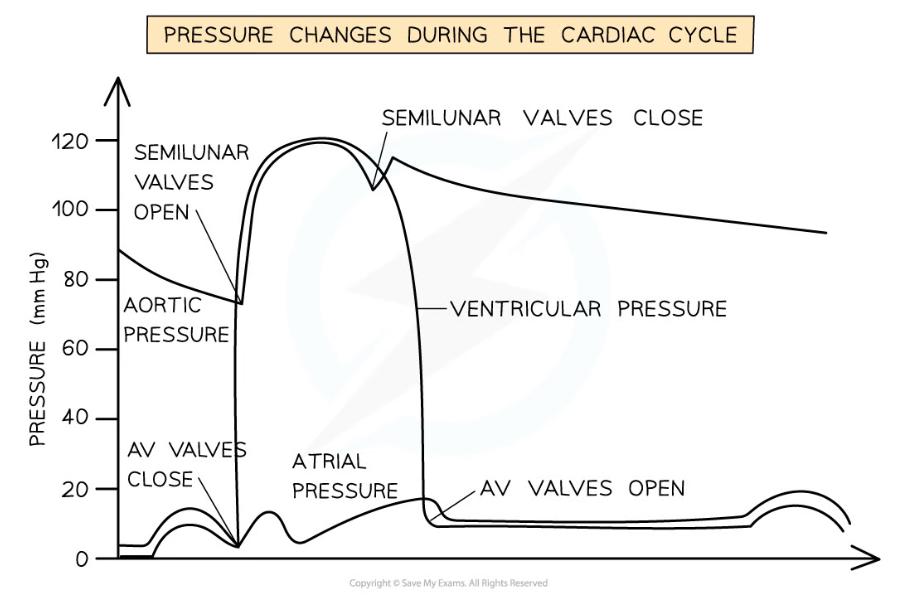
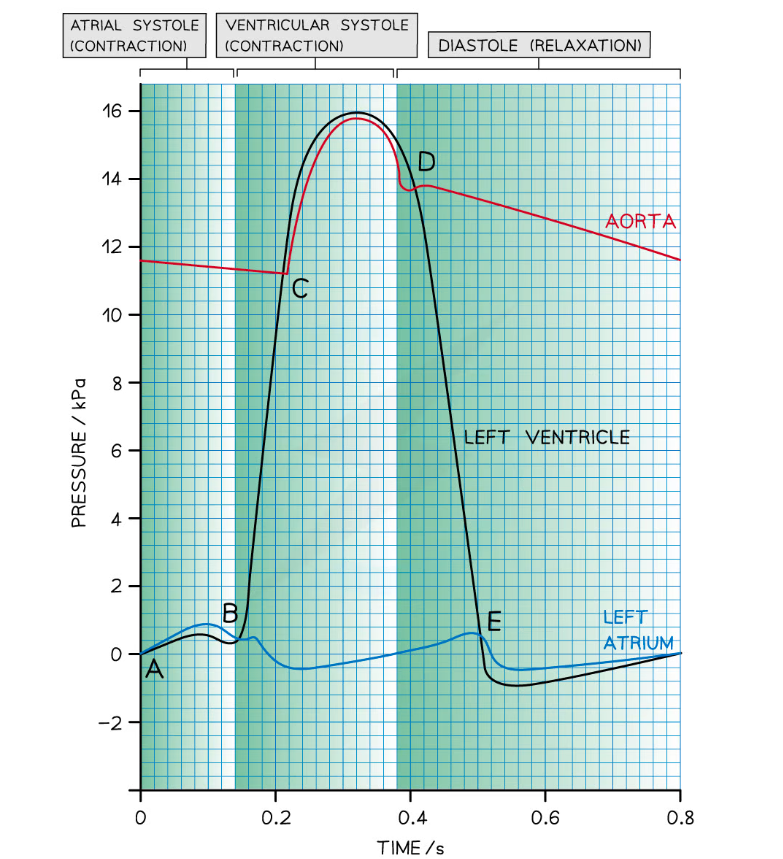
Analysing the cardiac cycle
- The lines on the graph represent the pressure of the left atrium, aorta, and the left ventricle
- The points at which the lines cross each other are important because they indicate when valves open and close
Point A - the end of diastole
- The atrium has filled with blood during the preceding diastole
- Pressure is higher in the atrium than in the ventricle, so the AV valve is open
Between points A and B - atrial systole
- Left atrium contracts, causing an increase in atrial pressure and forcing blood into the left ventricle
- Ventricular pressure increases slightly as it fills with blood
- Pressure is higher in the atrium than in the ventricle, so the AV valve is open
Point B - beginning of ventricular systole
- Left ventricle contracts causing the ventricular pressure to increase
- Pressure in the left atrium drops as the muscle relaxes
- Pressure in the ventricle exceeds pressure in the atrium, so the AV valve shuts
Point C - ventricular systole
- The ventricle continues to contract
- Pressure in the left ventricle exceeds that in the aorta
- Aortic valve opens and blood is forced into the aorta
Point D - beginning of diastole
- Left ventricle has been emptied of blood
- Muscles in the walls of the left ventricle relax and pressure falls below that in the newly filled aorta
- Aortic valve closes
Between points D and E - early diastole
- The ventricle remains relaxed and ventricular pressure continues to decrease
- In the meantime, blood is flowing into the relaxed atrium from the pulmonary vein, causing an increase in pressure
Point E - diastole
- The relaxed left atrium fills with blood, causing the pressure in the atrium to exceed that in the newly emptied ventricle
- AV valve opens
After point E - late diastole
- There is a short period of time during which the left ventricle expands due to relaxing muscles
- This increases the internal volume of the left ventricle and decreases the ventricular pressure
- At the same time, blood is flowing slowly through the newly opened AV valve into the left ventricle, causing a brief decrease in pressure in the left atrium
- The pressure in both the atrium and ventricle then increases slowly as they continue to fill with blood
 The pressure changes in the cardiac cycle can be analysed
Worked Example
The graph below shows the cardiac cycle.
Calculate the heart rate of this person. Give your answer in beats per minute.
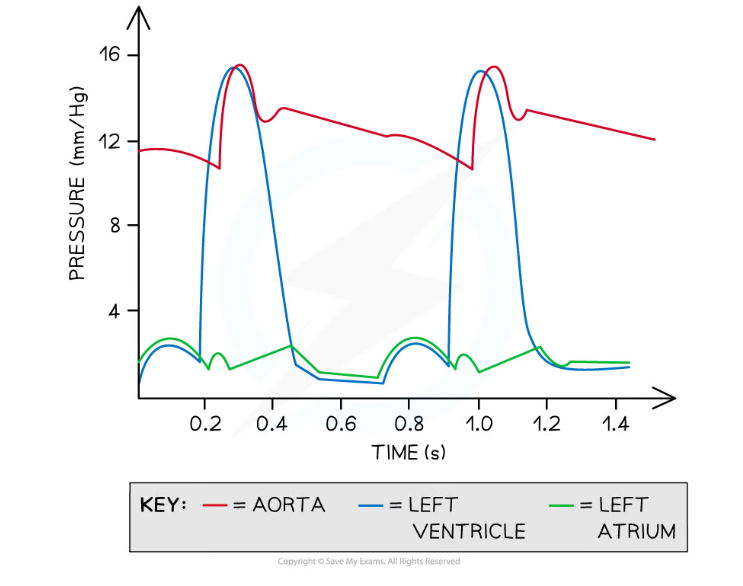
Step 1: Work out the length of one heart beat
It takes 0.7 seconds for completion of one cardiac cycle, which is one heart beat
So there is 1 cycle in 0.7 seconds
Step 2: Calculate how many heart beats occur per second
Divide by 0.7 to find out how many cycles in 1 second
1 ÷ 0.7 = 1.43 beats in 1 second
Step 3: Calculate how many heart beats occur per minute
Multiply by 60 to find out how many cycles in 60 seconds
1.43 × 60 = 85.71 beats in 60 seconds
So the heart rate is 85.71 beats / min
Exam Tip
You might be asked to interpret the graph of the cardiac cycle so it is important you understand it and can analyse where each stage of the cycle is happening. Common areas of assessment are about the pressure and volume changes, where valves open and close, and when blood starts flowing in or out of specific chambers.
转载自savemyexams
以上就是关于【Edexcel A (SNAB) A Level Biology:复习笔记1.1.5 Cardiac Cycle】的解答,如需了解学校/赛事/课程动态,可至翰林教育官网获取更多信息。
往期文章阅读推荐:
全网破防!ALevel CIE数学M1疑似错题?经济P2难度飙升?5月6日大考考情分析必看!
A-Level CIE就大规模泄题发布最严处罚!哪些考生必须重考?你的成绩怎么办?


翰林AMC8视频课重磅上线!

国际竞赛真题资源免费领取


