Edexcel A Level Physics:复习笔记10.4 The Hertzsprung-Russell Diagram

The Hertzsprung - Russell Diagram
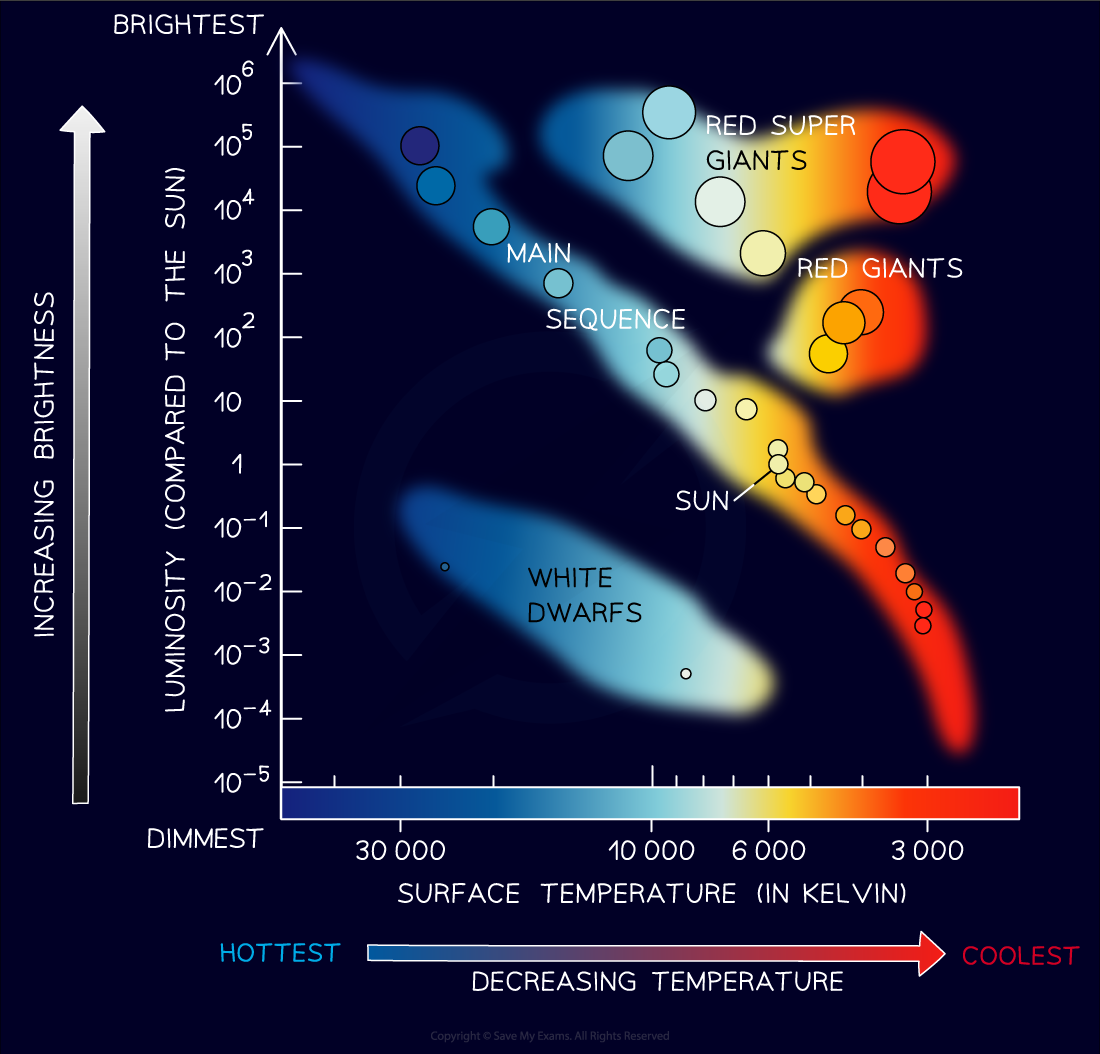
- Danish astronomer Ejnar Hertzsprung, and American astronomer Henry Noris Russell, independently plotted the luminosity of different stars against their temperature
- Luminosity relative to the Sun, on the y-axis, goes from dim (at the bottom) to bright (at the top)
- Temperature in degrees kelvin, on the x-axis, goes from hot (on the left) to cool (on the right)
The Hertzsprung-Russell Diagram
- Hertzsprung and Russel found that the stars clustered in distinct areas
- Most stars are clustered in a band called the main sequence
- For main sequence stars, luminosity increases with surface temperature
- A smaller number of stars clustered above the main sequence in two areas, red giants, and red super giants
- These stars show an increase in luminosity at cooler temperatures
- The only explanation for this is that these stars are much larger than main sequence stars
- Below and to the left of the main sequence are the white dwarf stars
- These stars are hot, but not very luminous
- Therefore, they must be much smaller than main sequence stars
- The Hertzsprung-Russell Diagram only shows stars that are in stable phases
- Transitory phases happen quickly in relation to the lifetime of a star
- Black holes cannot be seen since they emit no light
Worked Example
Stars can be classified using the Hertzsprung-Russell Diagram.
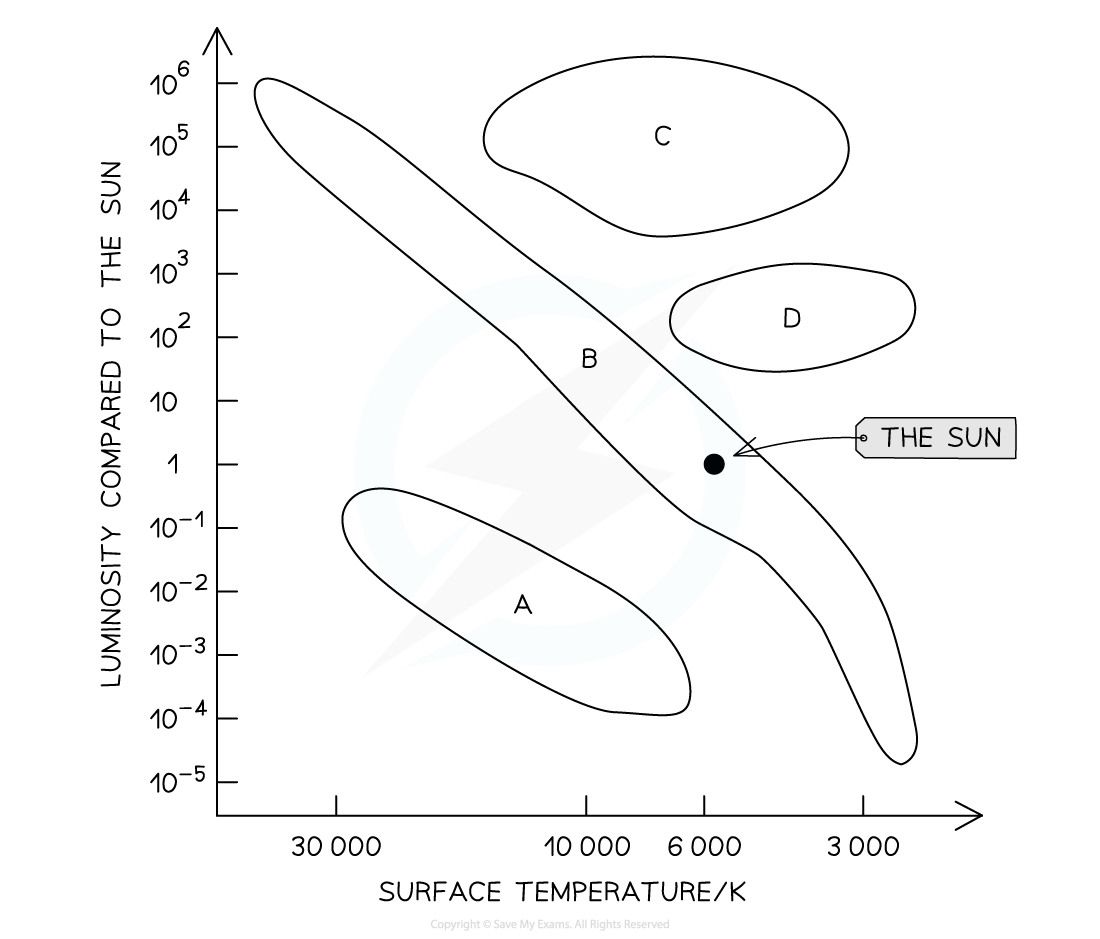
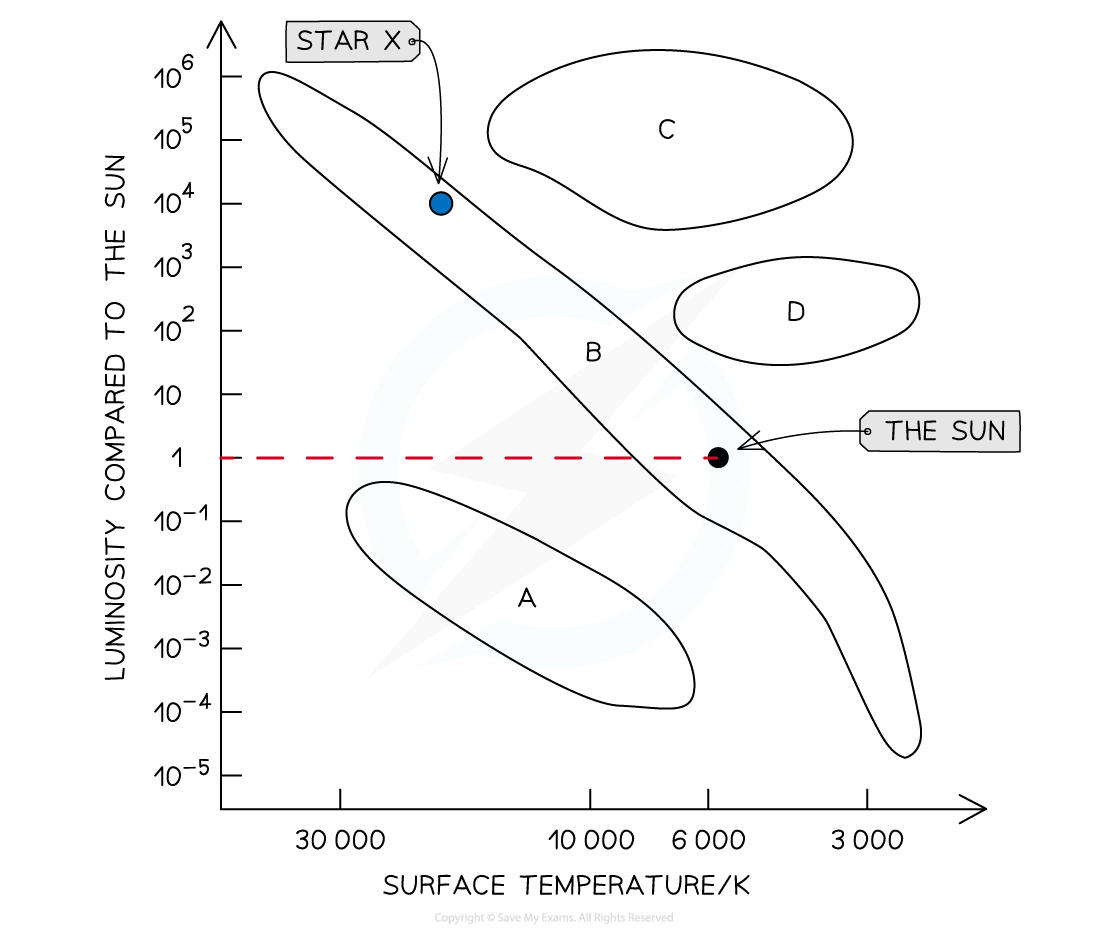
- State the types of stars found in areas A, B, C and D.
- Star X has a surface temperature of 20 000 K and a luminosity 10 000 times greater than the Sun. Plot star X’s place on the Hertzsprung-Russell diagram and label it Star X.
Step 1: Identify the main sequence on the Hertzsprung-Russell diagram
-
- The main sequence is the long band diagonally central to the diagram where the majority of stars are found
- The main sequence is region B
- The main sequence is the long band diagonally central to the diagram where the majority of stars are found
Step 2: Identify the white dwarf region on the HR diagram
-
- White dwarf stars are hot, but not very luminous
- Identify the area with a lower luminosity than the main sequence
- The white dwarf region is area A
Step 3: Identify the red giant and red supergiant regions on the HR diagram
-
- Red giants and super red giants have a greater luminosity than main sequence stars at a lower temperature
- Super red giants are more luminous than the red giants and will appear above them on the graph
- The super red giant region is area C
- The red giant region is area D
Step 4: List the known quantities given in part b
-
- Surface temperature of Star X = 20 000 K
- Luminosity of Star X = 10 000 times that of the Sun
Step 5: Use the graph to find the value for the luminosity of the Sun
-
- Use a ruler and pencil to draw a line from the position of the Sun to the luminosity axis (y-axis)
- The Sun’s luminosity on this scale is 1 because the luminosities given are relative to the luminosity of the Sun
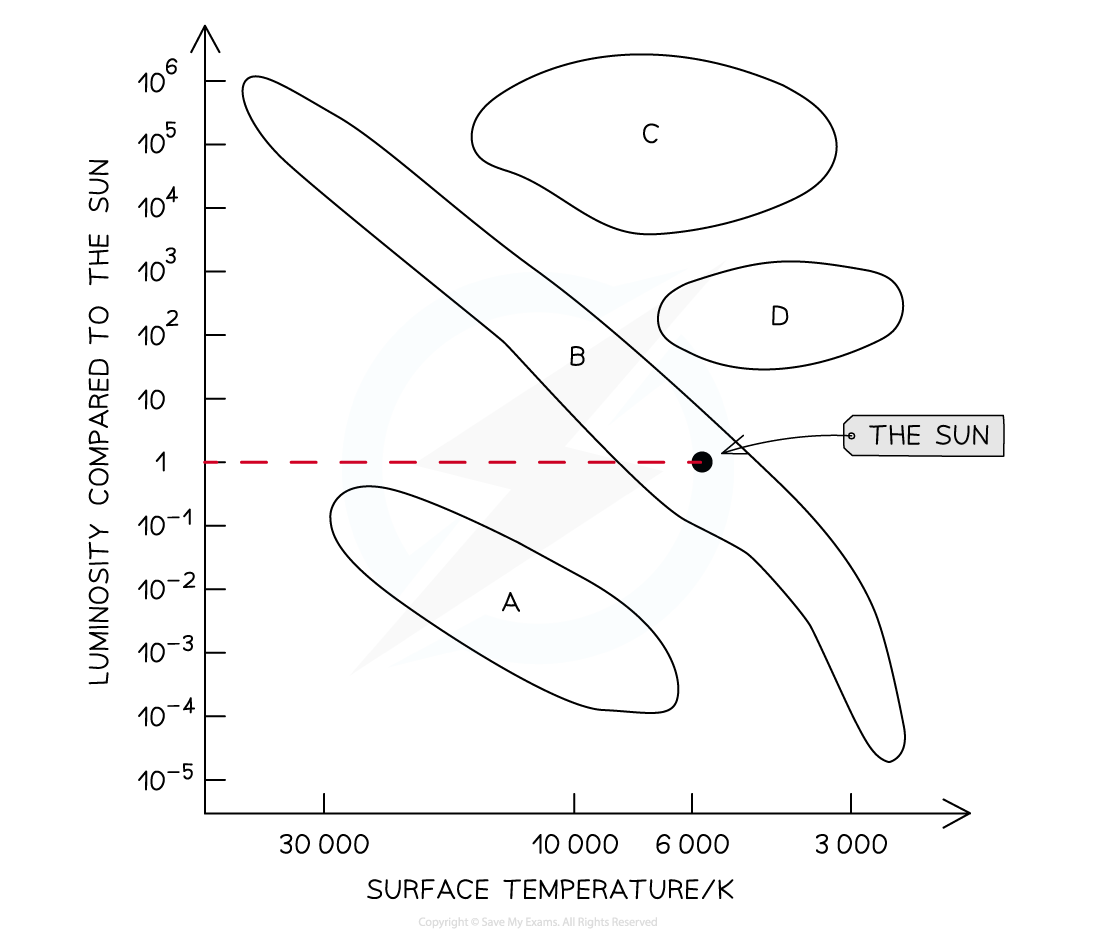
Step 6: Calculate the luminosity of Star X
-
- Star X is 10 000 times that of the Sun
- The luminosity of the Sun is 1
10 000 × 1 = 10 000 or 104
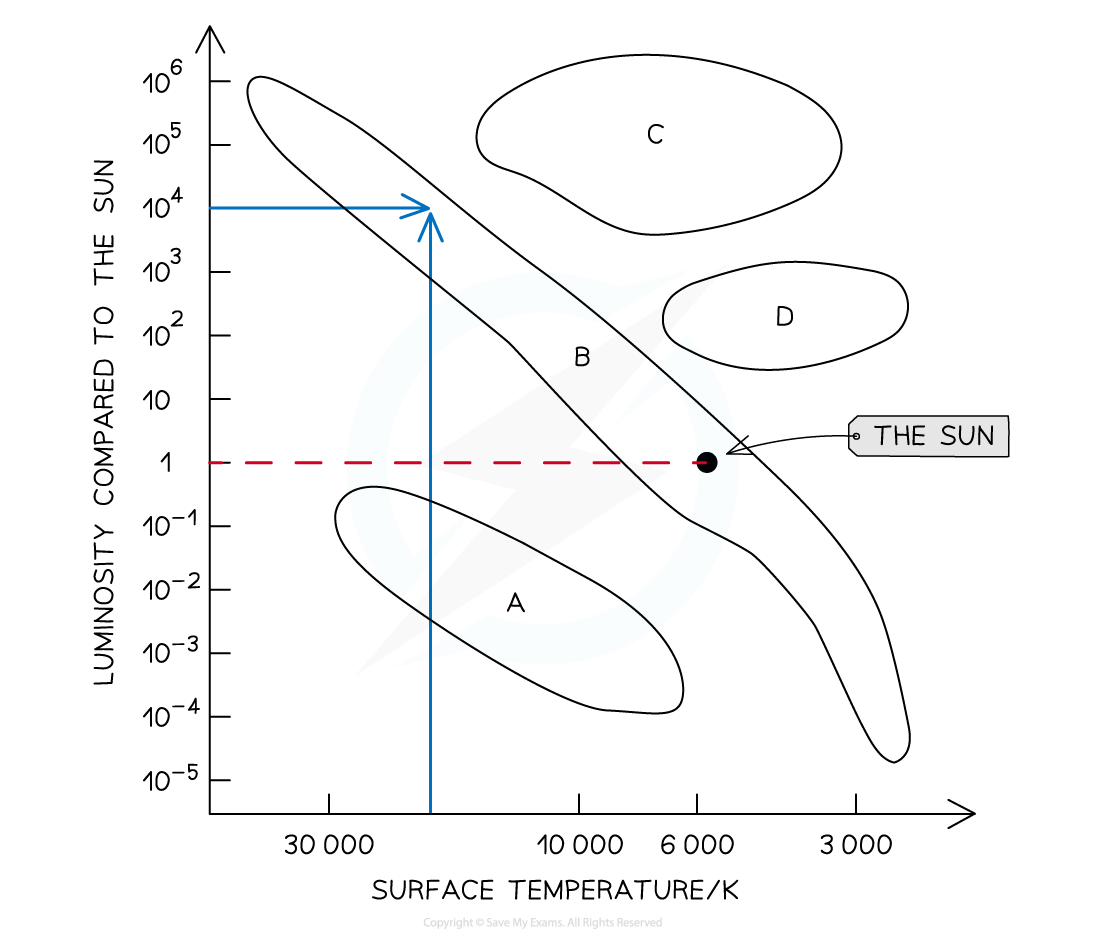
Step 7: Plot the position of Star X on the HR diagram
-
- Locate the surface temperature of Star X at 20 000 K
- Locate the luminosity of Star X at 104
-
-
- Plot the point and label it Star X
-
Exam Tip
The worked example is testing your ability to identify the distinct areas of the Hertzsprung-Russell diagram out of context.
When sketching for your revision notes practice considering what each region of the diagram describes in terms of temperature and luminosity and linking those descriptions to your knowledge of different types of stars.
转载自savemyexams
以上就是关于【Edexcel A Level Physics:复习笔记10.4 The Hertzsprung-Russell Diagram】的解答,如需了解学校/赛事/课程动态,可至翰林教育官网获取更多信息。
往期文章阅读推荐:
全网破防!ALevel CIE数学M1疑似错题?经济P2难度飙升?5月6日大考考情分析必看!
A-Level CIE就大规模泄题发布最严处罚!哪些考生必须重考?你的成绩怎么办?

翰林AMC8视频课重磅上线!

国际竞赛真题资源免费领取


