Edexcel A Level Economics A:复习笔记4.2.2 Inequality

Inequality
- Income & wealth inequality are two different concepts
- Income inequality refers to the unequal distribution (flow) of income to households i.e rent, wages, interest & profit
- Wealth inequality refers to differences in the amount of assets that households own
- The two main measures of income inequality are the Lorenz Curve & the Gini coefficient
The Lorenz Curve
- The Lorenz Curve is a visual representation of the inequality that exists between households in an economy
- Data is commonly presented in quintiles (population divided into 5 groups i.e 20%) or deciles (population divided into 10 groups i.e 10%)
- E.g. in 2021 42% of the income flow in the UK went to the top 20% of households while only 7% went to the bottom 20%
- Perfect income distribution is not the goal (20 % of the population get 20% of the income; 40% get 40% percent of the income etc.)
- That would equate to socialism & completely remove incentives for work as everyone would be paid equally
- More equal income distribution is desired as it reduces poverty & social unrest
- What constitutes acceptable income equality is a normative economic issue
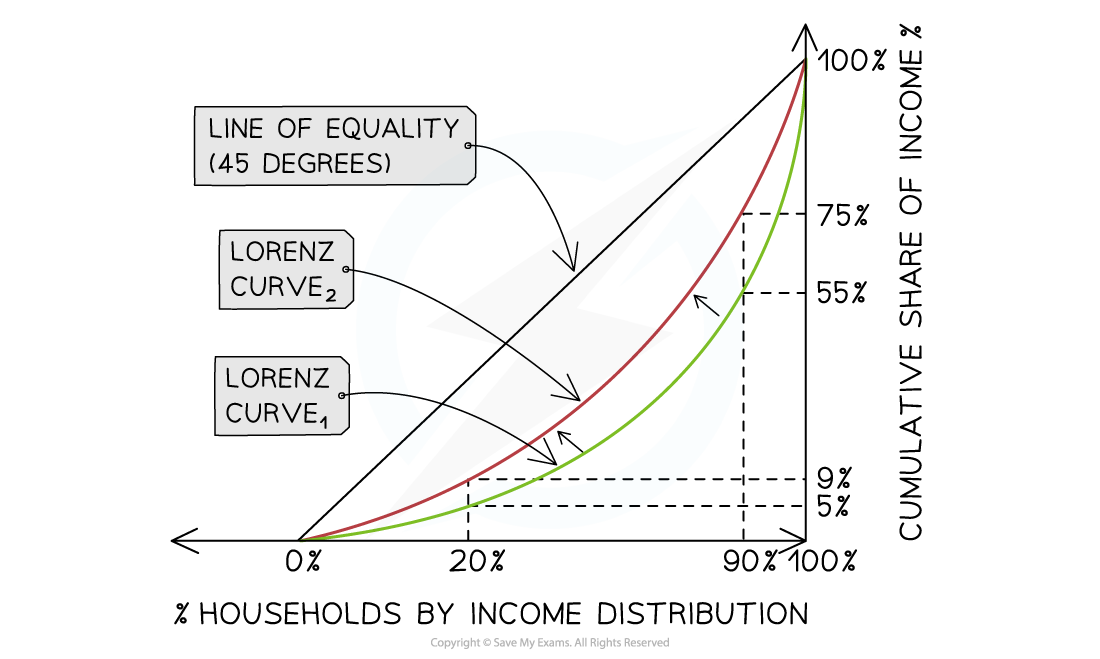
An illustration of Income Inequality for the UK (green line) & Sweden (red line) using a Lorenz Curve Model. The income distribution in the UK is more unequal than that of Sweden
Diagram Analysis
- The line of equality represents perfect income distribution (not desirable)
- In the UK the bottom 20% of households receive 5% of the income flow while in Sweden they receive 9% of the income flow
- In the UK the top 10% of households receive 45% of the income flow while in Sweden they receive 25%
- Sweden has a more equal distribution of income than the UK
The Gini Coefficient
- The Lorenz curve can be used to calculate the Gini Coefficient

The Gini Coefficient is calculated using the area beneath the line of equality
Diagram Explanation
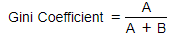
- A represents the area between the line of equality & the UK Lorenz curve
- B represents the area under the Lorenz curve
- A value of 0 represents absolute equality (socialism) & 1 represents perfect inequality
- In 2022, the USA coefficient was .41 as compared with the UK value of .35
- The distribution of income in the UK was more equitable than in the USA
Causes of Income & Wealth Inequality
- Numerous factors cause wealth & income inequality
- It is generally true that developed countries have a larger tax base & are able to provide a better level of support to the poorest households the economy, than developing countries are able to
Cause of Wealth & Income Inequality
| Education, Training & Skills | Trade Unions | Benefit system | Pension payments |
|
The higher the skill level the higher the level of income. A country with a poor education system will see greater inequality than one with a good education system |
Countries with strong trade union membership tend to have higher levels of income. With low trade union membership, the exploitation of workers through low wages is easier |
Countries that provide a range of benefits (such as unemployment, disability, child support, housing support etc) raise the income of the lowest 20% of the population resulting in more equal distribution |
State pension payments ensure a minimum standard of living for retirees resulting in a more equal distribution of income. Countries without it have a much higher percentage of pensioners living in poverty |
| Wage Rates | Employment Legislation | Tax Structure | Asset Ownership |
|
The purpose of a national minimum wage is to improve the equity in the distribution of income. Without it, more households would be earning less & inequality would increase |
Generally, the more workers are protected by law, the better the income distribution in an economy e.g. maternity benefits ensure that new mothers have a higher level of income during the first months of leave after a birth |
Progressive tax systems allow all income earners to contribute to public revenue according to their ability. Decreasing taxes on the lower end & increasing it on the upper end would mean that the system is more progressive & there would be a more equal distribution of income |
Assets generate income. The more equal the asset ownership in an economy the less the inequality in income distribution. This was one reason why the UK government changed the law in 1980 allowing council house tenants the right to buy their property at a discounted rate. It is also a reason for the current shared ownership scheme |
Impact of Economic Change & Development on Inequality
- In the 1950's Simon Kuznets developed a hypothesis that described how income inequality changed as an economy went through stages of industrialisation & development
- This hypothesis was explained using the Kuznets Curve
- Industrialisation results in increased inequality as some workers move from the lower productivity, lower paid agricultural sector into the higher productivity manufacturing sector
- There is now greater income inequality with the workers left behind
- However, at some point, inequality starts to decrease
- This is most likely due to government intervention/support funded by increased state tax revenue brought about as a result of the increased production in the economy
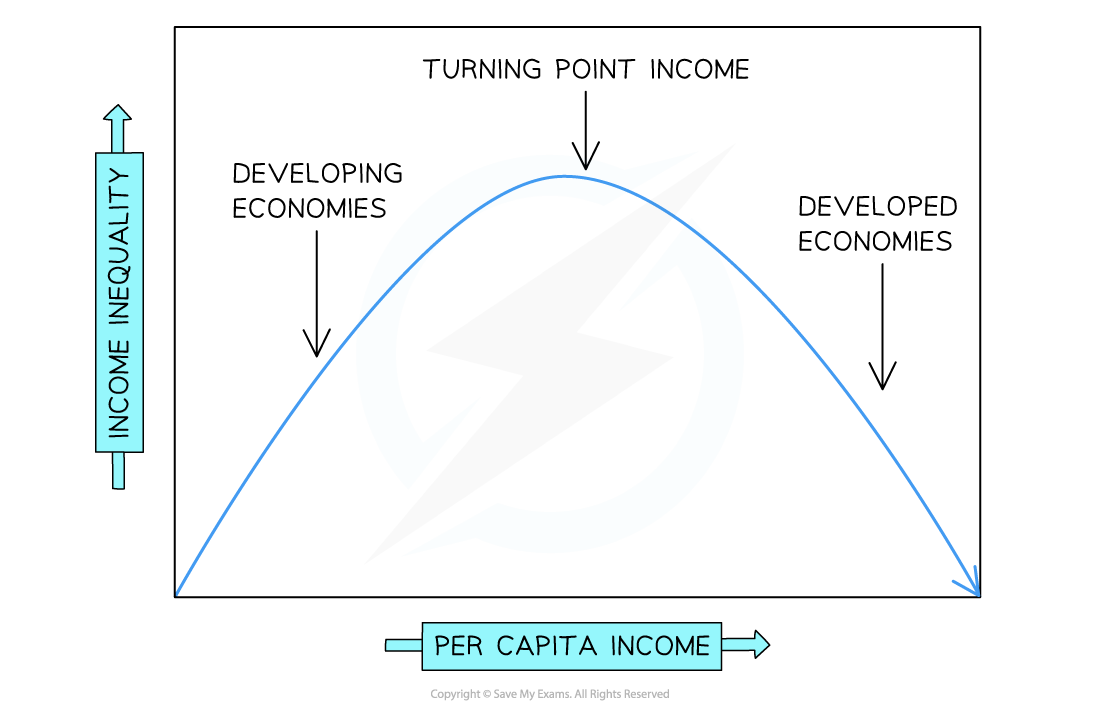
The Kuznets Curve illustrates how income inequality first increases with industrialisation before then decreasing
Diagram Analysis
- As a country changes sectors from primary (farming) to secondary (manufacturing), productivity increases & the per capita income increases
- However, inequality is also increasing as the gap in wages between the primary & secondary sector is significant
- At some point, the economy will reach a turning point of income where inequality begins to fall
- This often occurs as the primary sector diminishes while the secondary & tertiary (services) sectors increase
- Developed economies tend to generate more income from secondary & tertiary sectors
Exam Tip
The Kuznets Curve described above is not in the syllabus. However the Principal Examiner mentions it in the Guide as one way in which critical thinking can be demonstrated when approaching questions on income inequality in developing nations.
Capitalism & Inequality
- Capitalism is at the heart of free market economics
- Under Capitalism, inequality is inevitable
- Workers with higher skills receive higher wages
- Workers with little to no skills receive little to no wage
- Individuals with higher income will acquire more assets leading to higher levels of income
- In turn, they can keep on acquiring assets
- Individuals with lower income will find it hard to acquire assets
- The principles of capitalism are considered important as the incentive to acquire income raises productivity & output
- The long-term cost of capitalism is that the factors of production become concentrated in ownership with relatively few individuals developing extreme wealth, at the expense of many who lose out
- It has been argued that capitalism needs checks & balances to limit the income & wealth inequality that will naturally develop
- This calls for government intervention
转载自savemyexams
以上就是关于【Edexcel A Level Economics A:复习笔记4.2.2 Inequality】的解答,如需了解学校/赛事/课程动态,可至翰林教育官网获取更多信息。
往期文章阅读推荐:
全网破防!ALevel CIE数学M1疑似错题?经济P2难度飙升?5月6日大考考情分析必看!
A-Level CIE就大规模泄题发布最严处罚!哪些考生必须重考?你的成绩怎么办?


翰林AMC8视频课重磅上线!

国际竞赛真题资源免费领取


