Edexcel A Level Economics A:复习笔记2.3.3 Long-run AS

Keynesian Versus Classical Long-run AS
- Long run aggregate supply (LRAS) is influenced by a change in the productive capacity of the economy
- Productive capacity is changed by changes to the quantity or quality of the factors of production
- Economists have two opposing views on how LRAS works in an economy
- The original view is called the classical view
- The insights developed by John Meynard Keynes in 1936 are called the Keynesian view
The Classical LRAS View
- The classical view believes that the LRAS is perfectly inelastic (vertical) at a point of full employment of all available resources
- This point corresponds to the maximum possible output on a production possibilities frontier (PPF)
- The classical view believes that in the long-run an economy will always return to this full employment level of output
- There may be short-run output gaps in the economy
- During extreme periods of economic growth there can be an inflationary gap that develops
- In the long run this will self-correct and return to the long-run level of output, but at a higher average price level
- During slowdowns or recessions there can be a recessionary gap that develops
- In the long-run this will self-correct and return to the long-run level of output, but at a lower average price level
- During extreme periods of economic growth there can be an inflationary gap that develops
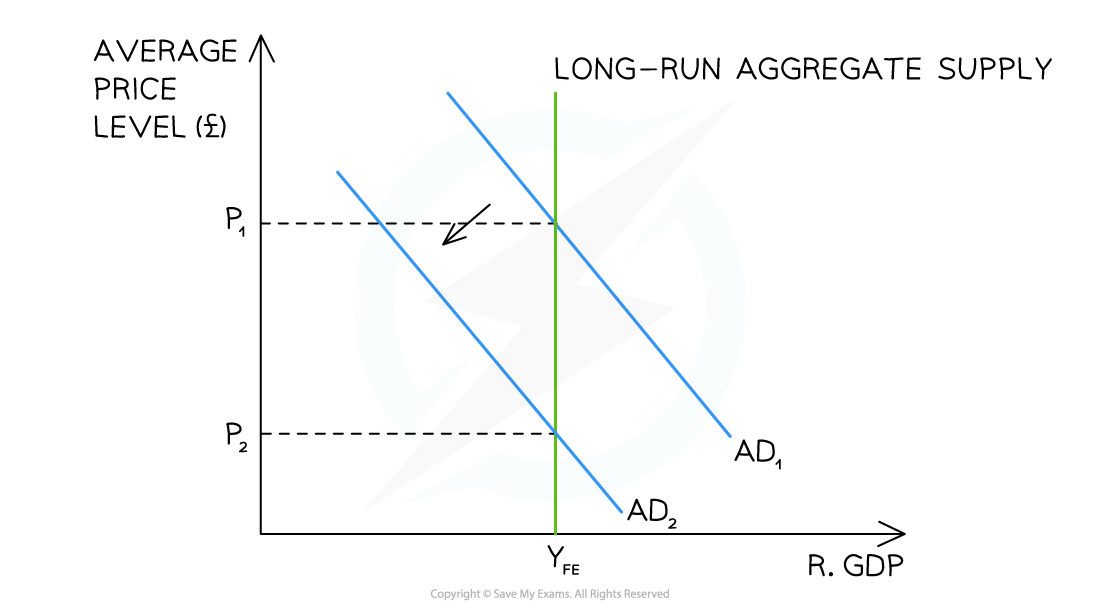
A diagram that shows the Classical View of long-run aggregate supply (LRAS) with a vertical aggregate supply curve at the full employment level of output (YFE)
Diagram Analysis
- Using all available factors of production, the long-term output of this economy (LRAS) occurs at YFE
- The economy is initially in equilibrium at the intersection of AD1 and LRAS (P1, YFE)
- A slowdown reduces output from AD1→AD2 and creates a short term recessionary gap
- This self corrects in the long term and returns the economy to the long-run equilibrium at the intersection of AD2 and LRAS (P2, YFE)
The Keynesian LRAS View
- Keynes believed that the long-run aggregate supply curve (LRAS) was more L shaped
- Supply is elastic at lower levels of output as there is a lot of spare production capacity in the economy
- Struggling firms will increase output without raising prices
- Supply is perfectly inelastic (vertical) at a point of full employment (YFE) of all available resources
- The closer the economy gets to this point the more price inflation will occur as firms compete for scarce resources
- Supply is elastic at lower levels of output as there is a lot of spare production capacity in the economy
- The Keynesian view believes that an economy will not always self-correct and return to the full employment level of output (YFE)
- It can get stuck at an equilibrium well below the full employment level of output e.g. Great Depression
- The Keynesian view believes that there is role for the government to increase its expenditure so as to shift aggregate demand and change the negative 'animal spirits' in the economy
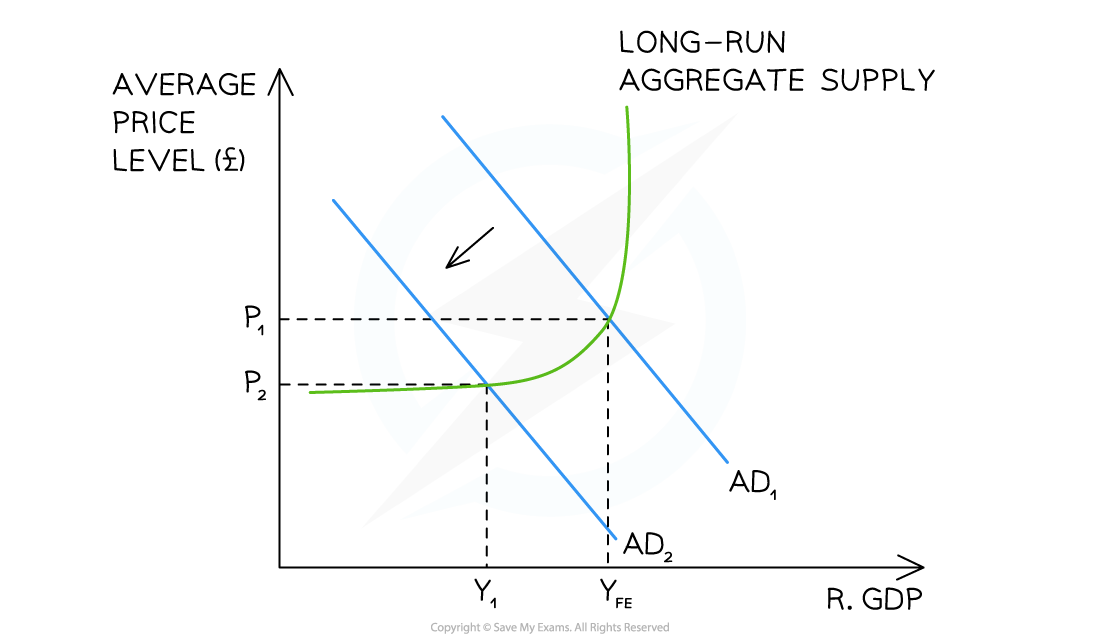
A diagram that shows the Keynesian View of long-run aggregate supply (LRAS) with a vertical aggregate supply curve at the full employment level of output (YFE) becoming more elastic at lower levels of output
Diagram Analysis
- Using all available factors of production, the long-term output of this economy (LRAS) occurs at YFE
- The economy is initially in equilibrium at the intersection of AD1 and LRAS (P1, YFE)
- A slowdown reduces output from AD1→AD2 and creates a recessionary gap Y1-YFE
- The economy may reach a point where average prices stop falling (P2), but output continues to fall
- This economy may not self-correct to YFE for years
- The low output leads to high unemployment and low confidence in the economy
- This stops further investment and further reduces consumption
- Keynes argued that this was where governments needed to intervene with significant expenditure e.g. Roosevelt's New Deal; response to financial crisis of 2008
Factors Influencing Long-run AS
- Any factor that changes the quantity or quality of a factor of production will impact the long-run aggregate supply (LRAS) of an economy:
- This corresponds to an outward or inward shift of the potential output of an economy on the production possibilities frontier
- The following factors will shift the entire LRAS curve outwards and increase the potential output of the economy:
- Technological advances: these often improve the quality of the factors of production e.g. development of metal alloys
- Changes in relative productivity: process innovation often results in productivity improvement e.g. moving from labour intensive car production to automated car production
- Changes in education and skills: over time this increases the quality of labour in an economy
- Changes in government regulations: these can improve the quantity of the factors of production. e.g. deregulation of fracking (extracting oil from shale deposits) increased oil reserves
- Demographic changes and migration: a positive net birth rate or positive net migration rate will increase the quantity of labour available
- Competition policy: regulating industries so as to prevent monopoly power results in more firms supplying goods/services in an economy and this increases the potential output of an economy
Exam Tip
You will frequently be examined on your understanding of factors that shift the short-run aggregate supply (SRAS) curve and long-run aggregate supply (LRAS) curve.
Make sure you know the difference and remember that LRAS factors will shift the entire LRAS curve to the right, representing an increase in the potential output of the economy. Changes to SRAS do not change the potential output of the economy.
This is the impact a long-run shift will have:
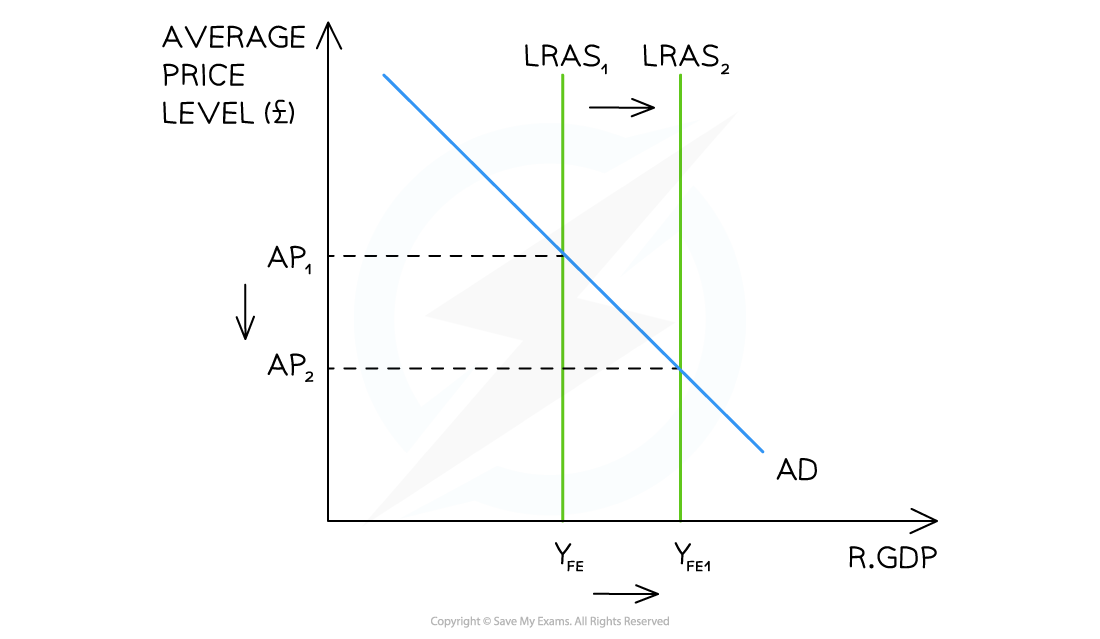 A diagram illustrating long-run economic growth through a change in one of the factors that shift the long-run aggregate supply (LRAS) of the economy
转载自savemyexams
以上就是关于【Edexcel A Level Economics A:复习笔记2.3.3 Long-run AS】的解答,如需了解学校/赛事/课程动态,可至翰林教育官网获取更多信息。
往期文章阅读推荐:
全网破防!ALevel CIE数学M1疑似错题?经济P2难度飙升?5月6日大考考情分析必看!
A-Level CIE就大规模泄题发布最严处罚!哪些考生必须重考?你的成绩怎么办?


翰林AMC8视频课重磅上线!

国际竞赛真题资源免费领取


