AQA A Level Maths: Statistics复习笔记3.1.2 Venn Diagrams

Venn Diagrams
What is a Venn diagram?
- A Venn diagram is a way to illustrate events from an experiment and are particularly useful when there is an overlap (or lack of) between possible outcomes
- A Venn diagram consists of
- a rectangle representing the sample space
- a bubble (usually drawn as a circle/ellipse/oval) for each event
- Bubbles may or may not overlap depending on which outcomes are shared between events
- Bubble(s) is not a technical term but we like it!
How are Venn diagrams labelled and what do the numbers inside mean?
 There is no standardised symbol used for this purpose
- Bubbles are labelled with their event name (A, B, etc)
- The numbers inside a Venn diagram (there should be one in each region) will represent either a frequency or a probability
- In the case of probabilities being shown, all values should total 1
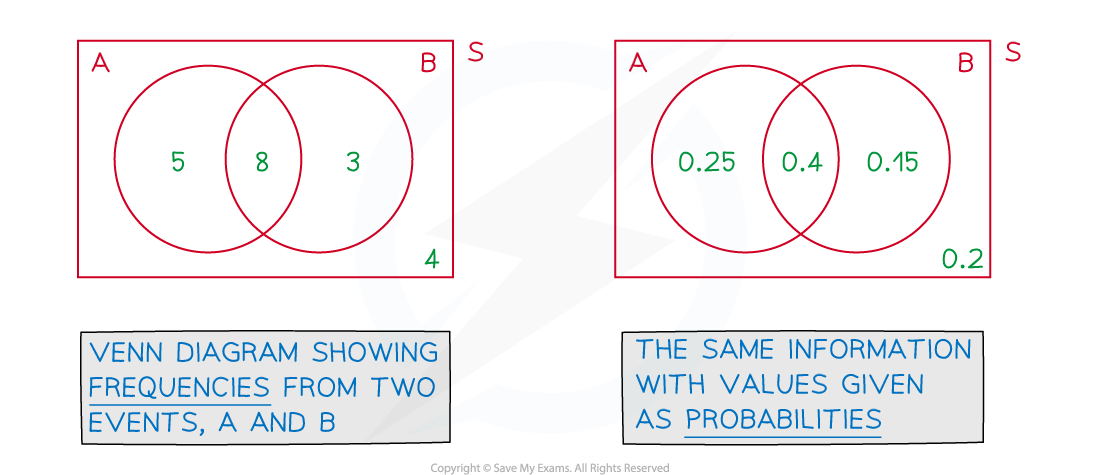
What do the different regions and bubbles overlapping mean on a Venn diagram?
- This will depend on how many events there are and how the outcomes overlap
- Venn diagrams show ‘AND’ and ‘OR’ statements easily
- Venn diagrams also instantly show mutually exclusive events
- Independence can be deduced from the probabilities involved
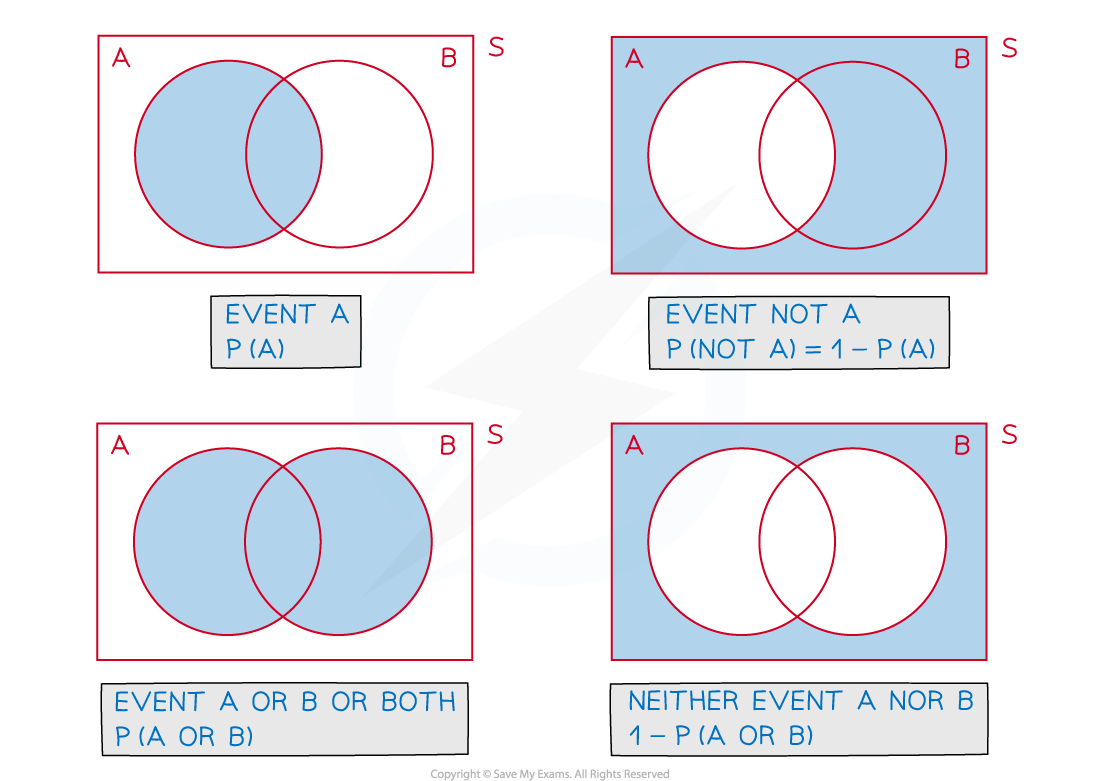
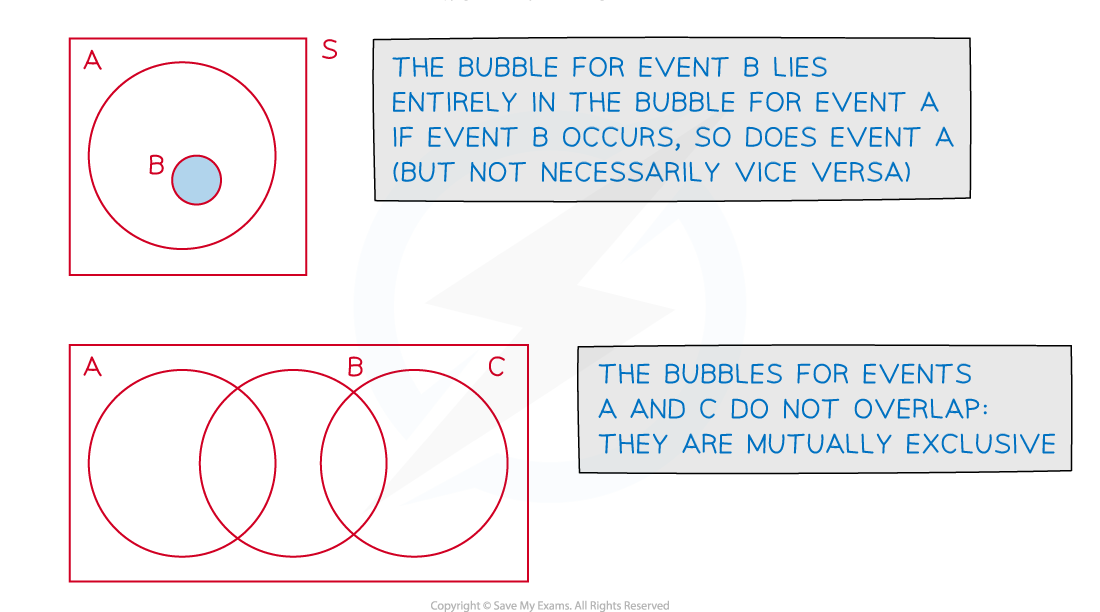
How do I solve probability problems involving Venn diagrams?
- Draw, or add to a given Venn diagram, filling in as many values as possible from the information provided in the question
- It is usually helpful to work from the centre outwards
- i.e. fill in intersections (overlaps) first
- This is particularly crucial with Venn diagrams with three events
 Check a completed Venn diagram that the frequencies sum to the total involved or that probabilities sum to 1
Worked Example
 (a)Draw a complete Venn diagram to illustrate the information given above.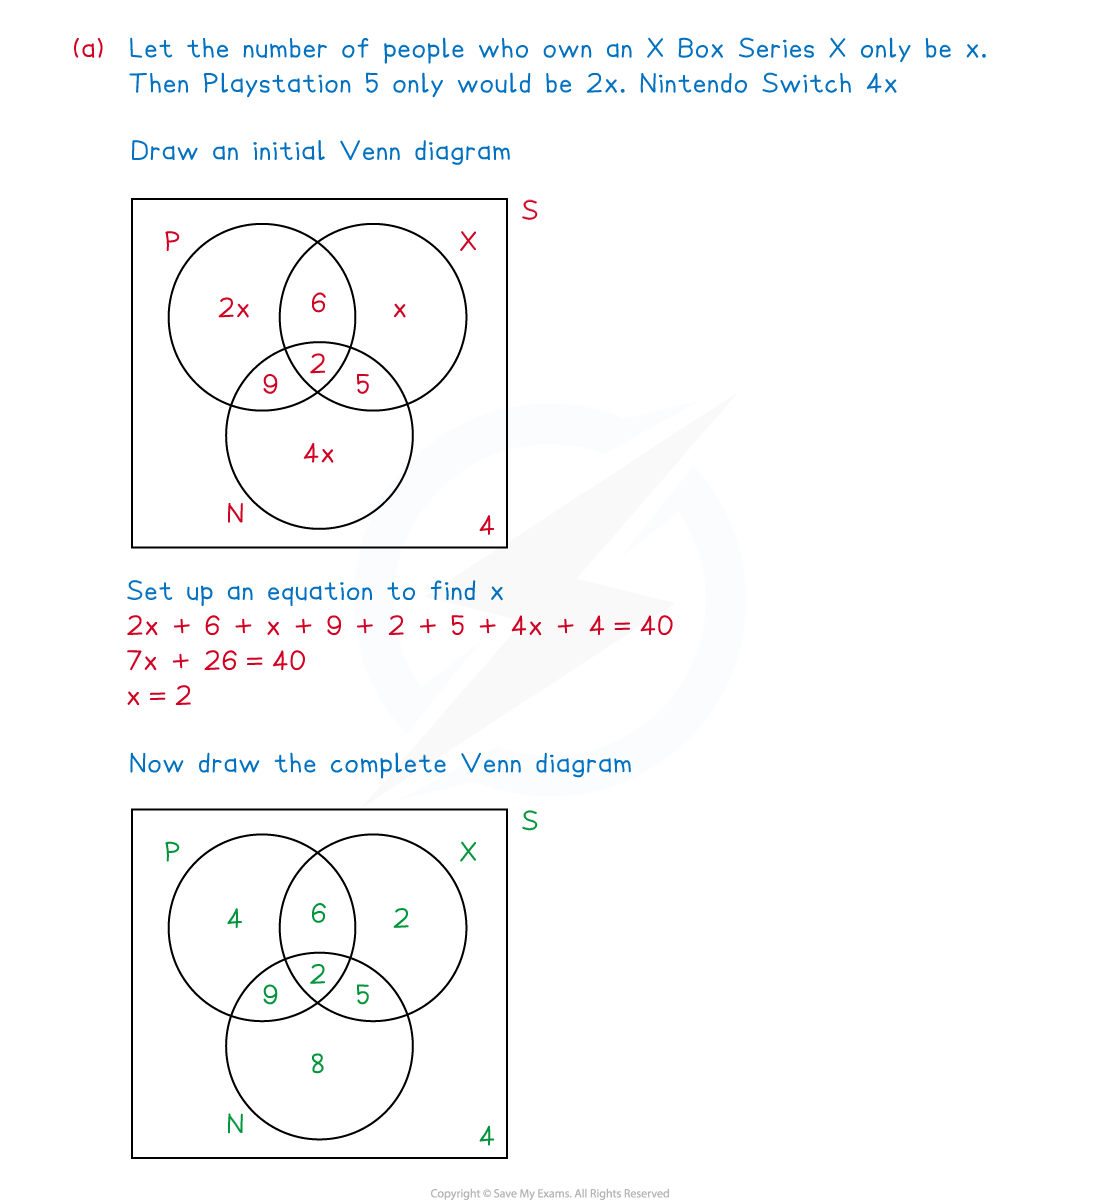
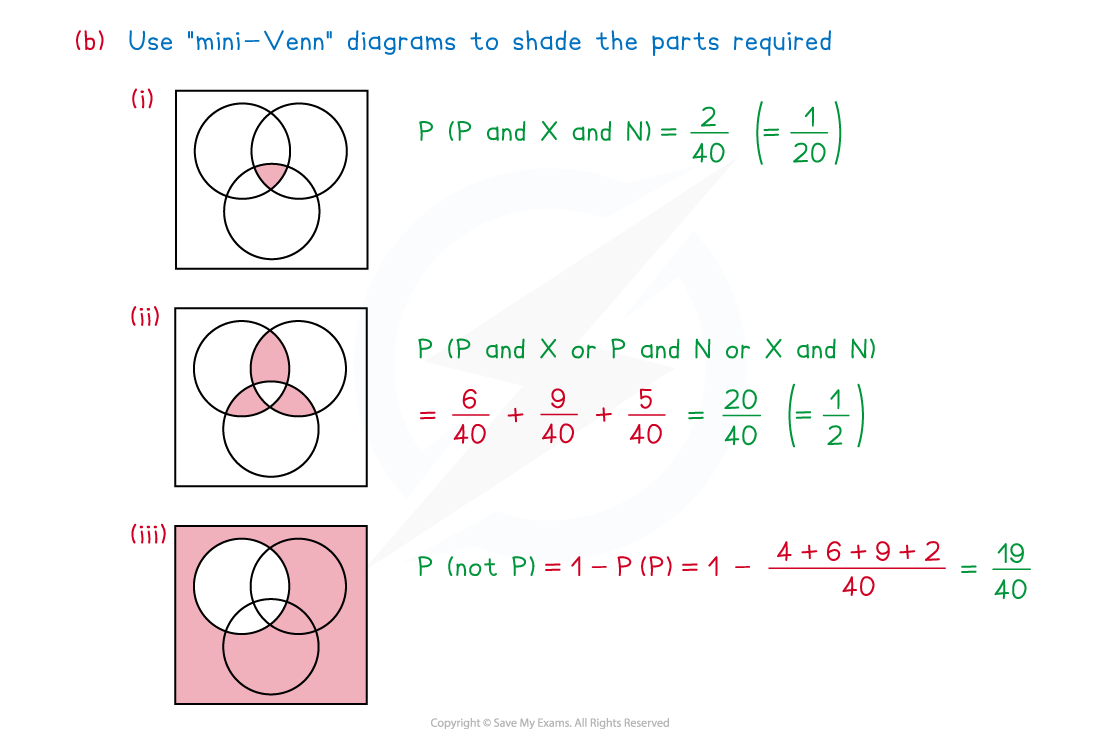
(b)One of the 40 people is chosen at random. Find the probability that this person
(i)owns all three consoles,
(ii)owns exactly two consoles,
(iii)doesn’t own a Playstation 5.


Exam Tip
- Always draw the box in a Venn diagram; it represents all possible outcomes of the experiment so is a crucial part of the diagram, the bubbles merely represent the events we are particularly interested in
- In complicated problems it can be helpful to draw a “mini-Venn” diagram for part of a question and shade/label the regions of the diagram that are relevant to that part
转载自savemyexams
以上就是关于【AQA A Level Maths: Statistics复习笔记3.1.2 Venn Diagrams】的解答,如需了解学校/赛事/课程动态,可至翰林教育官网获取更多信息。
往期文章阅读推荐:
翰林独家 | 经济学竞赛核心精讲,一册打通NEC/IEO/USAEBO!
2026 ALEVEL 夏考A率出炉!爱德思vs牛津AQA,哪些科目真的“好出分”?


翰林AMC8视频课重磅上线!

国际竞赛真题资源免费领取






