IB DP Chemistry: HL复习笔记6.1.3 Measuring Rates

Measuring Rates
- To measure the rate of a reaction, we need to be able to measure either how quickly the reactants are used up or how quickly the products are formed
- The method used for measuring depends on the substances involved
- There are a number of ways to measure a reaction rate in the lab; they all depend on some property that changes during the course of the reaction
- That property is taken to be proportional to the concentration of the reactant or product, e.g., colour, mass, volume
- Some reaction rates can be measured as the reaction proceeds (this generates more data);
- faster reactions can be easier to measure when the reaction is over, by averaging a collected measurement over the course of the reaction
- Three commonly used techniques are:
- mass loss
- gas production
- colorimetry
Changes in colour
- A colorimeter measures the amount of light that passes through a solution
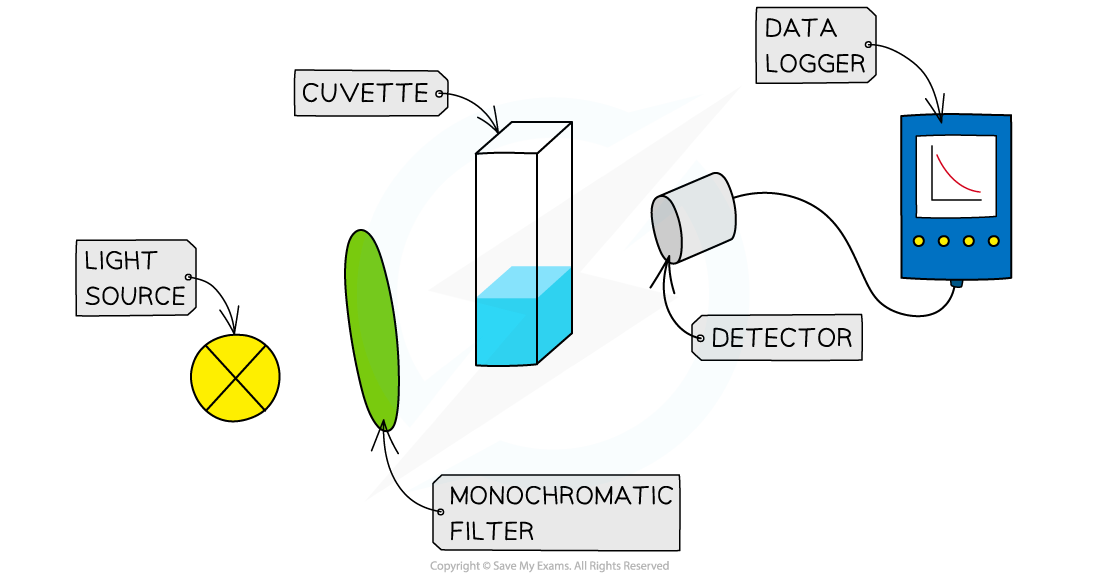
Colorimetry Set Up
- If a solution changes colour during a reaction this can be used to measure the rate
- The intensity of light reaching the detector is measured every few seconds and the data is plotted to show how the concentration of the reactants or products changes with time
- The light intensity is related to the concentration, so the graph represents a graph of concentration of products or reactants against time
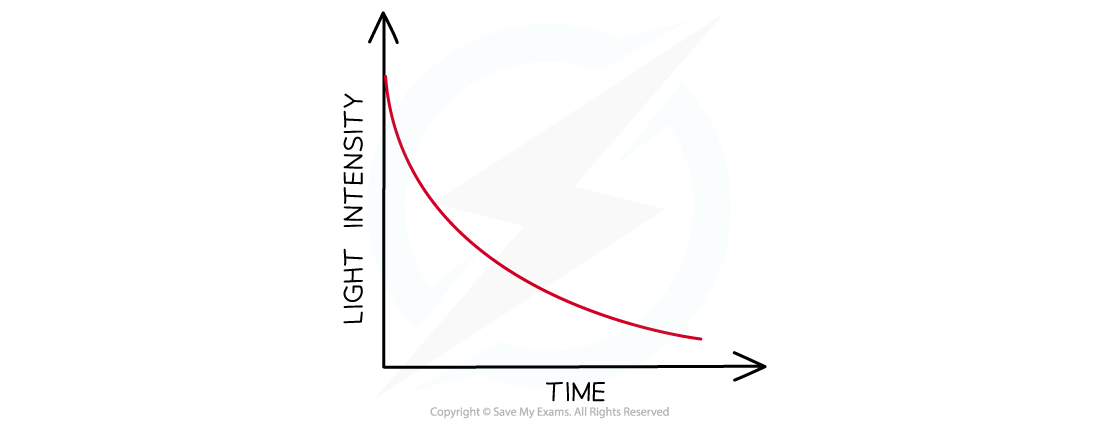
Sketch graph of colour intensity against time (the coloured species is a reactant in this case)
- Note that colorimetry cannot be used to monitor the formation of coloured precipitates as the light will be scattered or blocked by the precipitate
Changes in mass
- When a gas is produced in a reaction it usually escapes from the reaction vessel, so the mass decreases
- This can be used to measure the rate of reaction
- For example, the reaction of calcium carbonate with hydrochloric acid produces CO2
- The mass is measured every few seconds and change in mass over time is plotted as the CO2 escapes
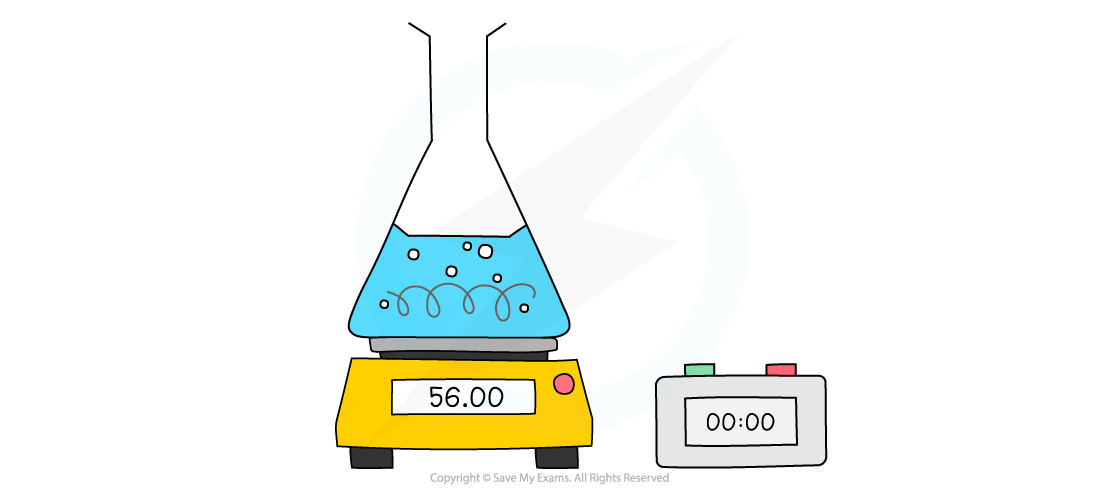
Measuring changes in mass using a balance
- The mass loss provides a measure of the amount of reactant, so the graph is the same as a graph of amount of reactant against time
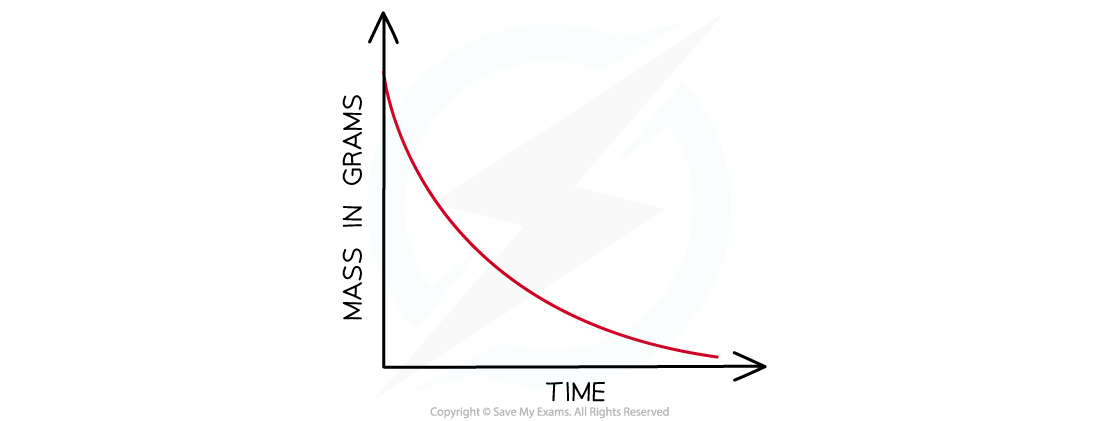
Mass loss of a product against time
- However, one limitation of this method is the gas must be sufficiently dense or the change in mass is too small to measure on a 2 or 3 dp balance
- So carbon dioxide would be suitable (Mr = 44) but hydrogen would not (Mr = 2)
Volumes of gases
- When a gas is produced in a reaction, it can be trapped and its volume measured over time
- This can be used to measure the rate of reaction.
- For example, the reaction of magnesium with hydrochloric acid produces hydrogen
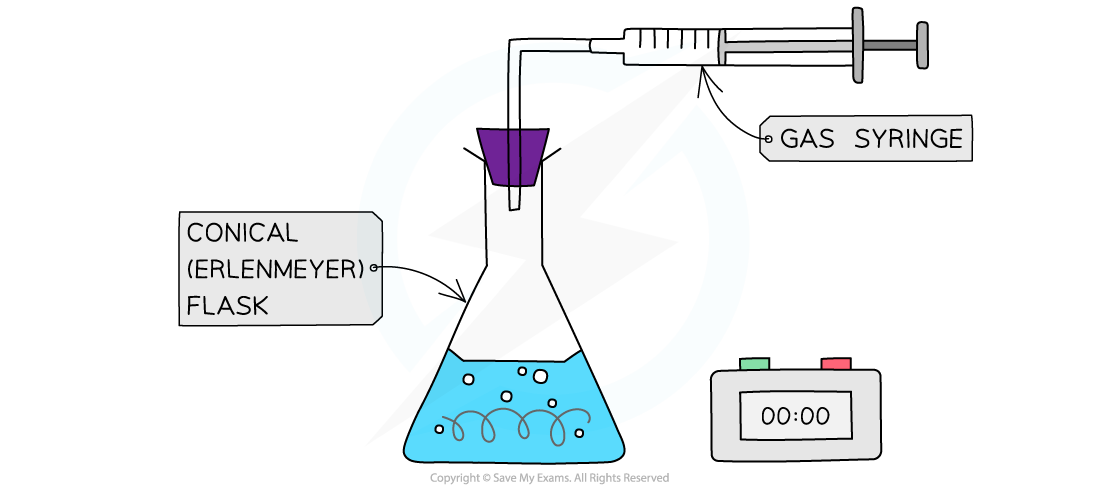
Collecting gases experimental set up
- An alternative gas collection set up involves collecting a gas through water using an inverted measuring cylinder ( as long as the gas is not water soluble)
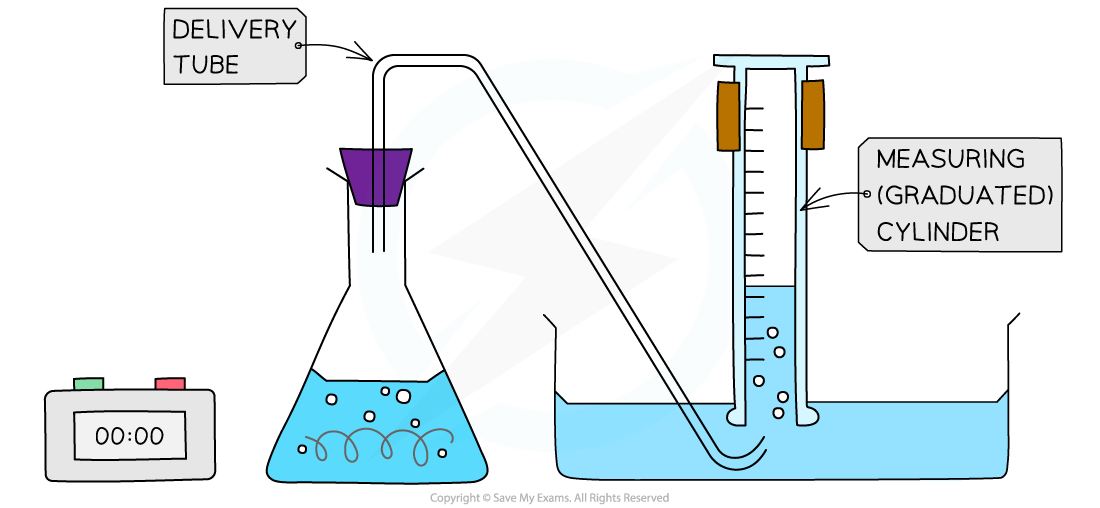
Alternative gas collection set up
- The volume can be measured every few seconds and plotted to show how the volume of gas varies with time
- The volume provides a measure of the amount of product, so the graph is a graph of amount of product against time
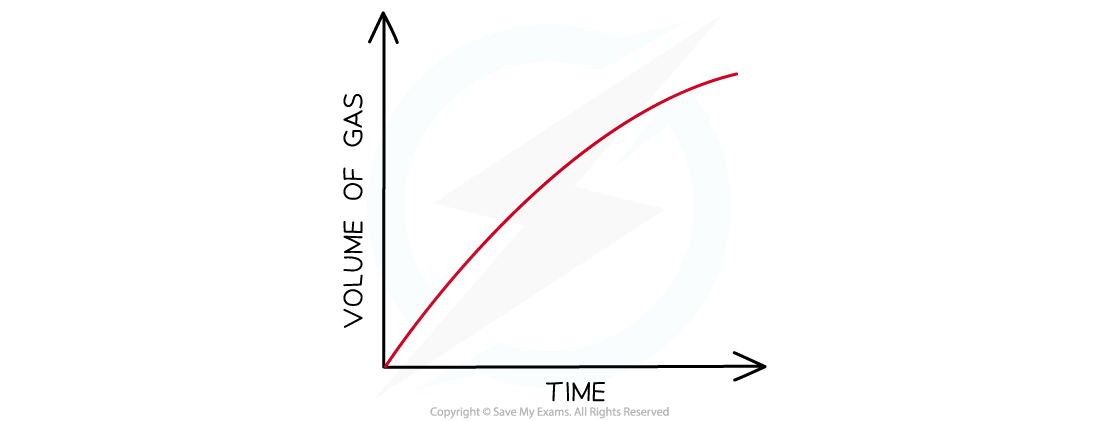
Graph of gas volume evolved against time
Measuring concentration changes
- Measuring concentration changes during a reaction is not easy; the act of taking a sample and analysing it by titration can affect the rate of reaction (unless the reaction is deliberately stopped- this is called quenching).
- Often it is more convenient to ‘stop the clock’ when a specific (visible) point in the reaction is reached
- For example when a piece of magnesium dissolves completely in hydrochloric acid
- Another common rate experiment is the reaction between sodium thiosulfate and hydrochloric acid which slowly produces a yellow precipitate of sulfur that obscures a cross when viewed through the solution:
Na2S2O3 (aq) + 2HCl (aq) → 2NaCl aq) + SO2 (g) + H2O (l) + S(s)
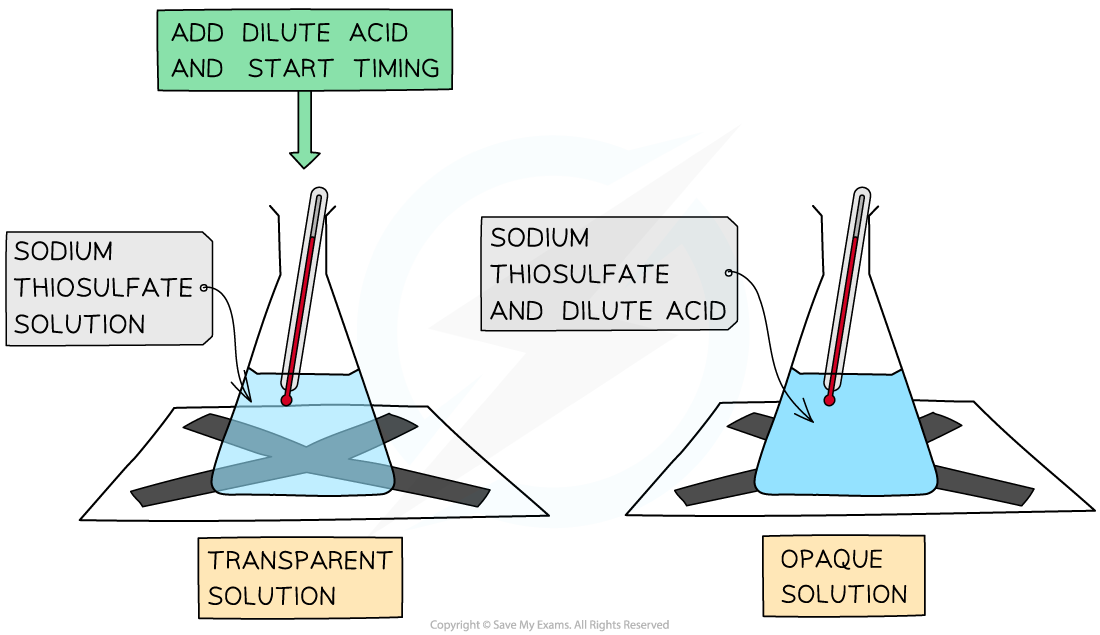
The disappearing cross experiment
- The main limitation here is that often it only generates one piece of data for analysis
Exam Tip
You should be familiar with the interpretation of graphs of changes in concentration, volume or mass against time and be able to calculate a rate from a tangent to the graph
转载自savemyexams
以上就是关于【IB DP Chemistry: HL复习笔记6.1.3 Measuring Rates】的解答,如需了解学校/赛事/课程动态,可至翰林教育官网获取更多信息。
往期文章阅读推荐:
翰林独家 | 经济学竞赛核心精讲,一册打通NEC/IEO/USAEBO!
2026 AMC10/12美国数学竞赛新赛季!【翰林教育 × 清华大学出版社】独家教材全面发售!


翰林AMC8视频课重磅上线!

国际竞赛真题资源免费领取






