IB DP Biology: HL复习笔记2.8.3 Skills: Photosynthesis

Absorption & Action Spectrums
- An absorption spectrum (for a particular pigment) shows how much light of different wavelengths is absorbed by the pigment
- An action spectrum shows how each wavelength of light affects the rate of photosynthesis that it can power
- These are two graphs that use the wavelength of light on the x-axis
- Violet light is the lowest wavelength of the visible spectrum, at 400 nanometres (nm)
- Red light is the highest wavelength of the visible spectrum, at 700 nanometres (nm)
Drawing an absorption spectrum for chlorophyll
Step 1: Draw and label the axes
- Draw an x-axis
- Label the axis wavelength
- Add the units / nm
- Make 400 the smallest value and 700 the largest value
- Label 500 and 600 nm on the x-axis
Draw a y-axis
- Label it % absorption
- Make 0 the lowest value and 100 the highest value
- No units are required because the y-axis is showing a percentage scale
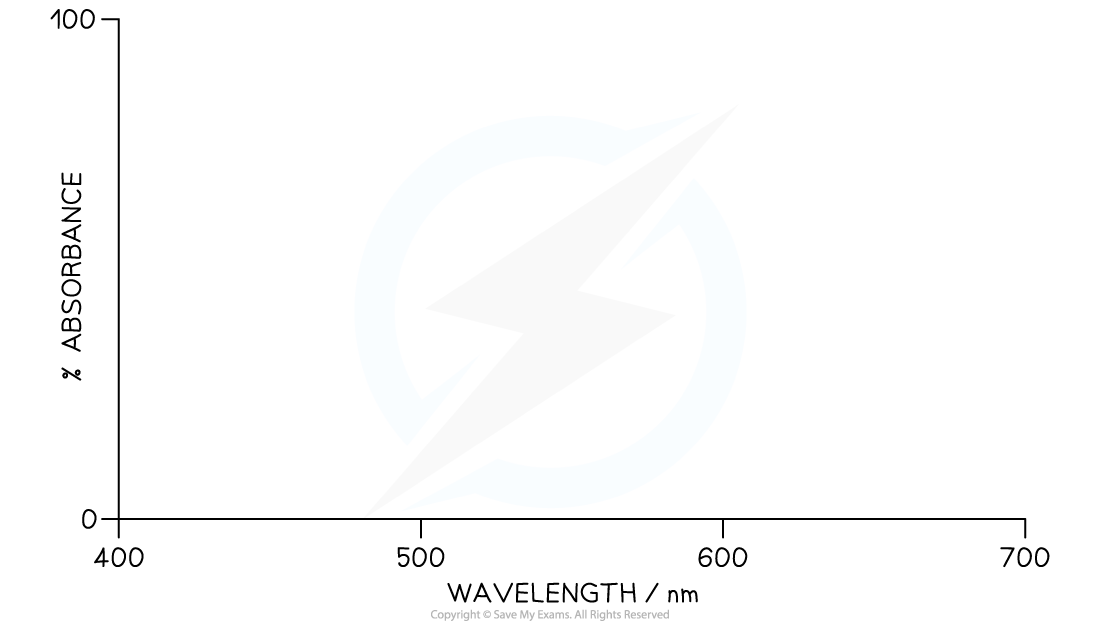
Step 1 : Draw and label the axes
Step 2: Draw the Plot
- There should be two absorbance peaks
- One peak at either end, in the blue and red areas of the spectrum
- And a trough in the middle, which represents green light
- As below, with a smooth curve
Step 2: Sketch the Curve
An absorbance spectrum for photosynthesis (colour range labels are not required)
Drawing an action spectrum for photosynthesis
Step 1: Draw and label the axes
- Draw an x-axis
- Label the axis wavelength
- Add the units / nm
- Make 400 the smallest value and 700 the largest value
- Label 500 and 600 nm on the x-axis
Draw a y-axis
- Label it Rate of photosynthesis / % of maximum rate
- Make 0 the lowest value and 100 the highest value
- No units are required because the y-axis is showing a percentage scale
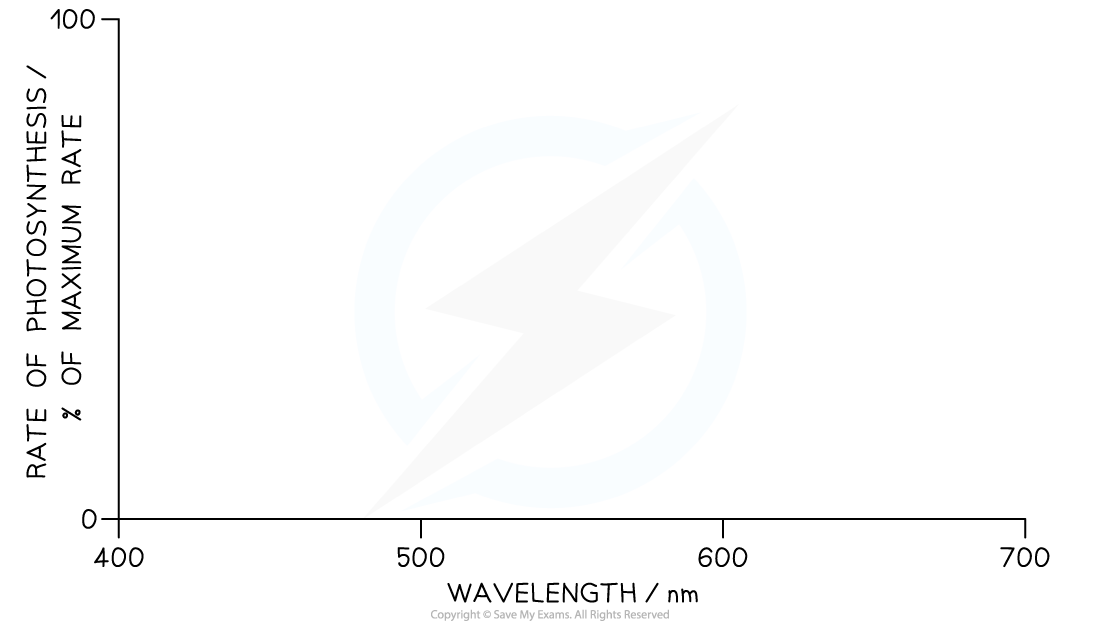
Step 1 : Draw and label the axes
Step 2: Draw the plot
- There should be two peaks of rate of photosynthesis
- One peak at either end, in the blue and red areas of the spectrum
- And a trough in the middle, which represents green light
- As below, with a smooth curve
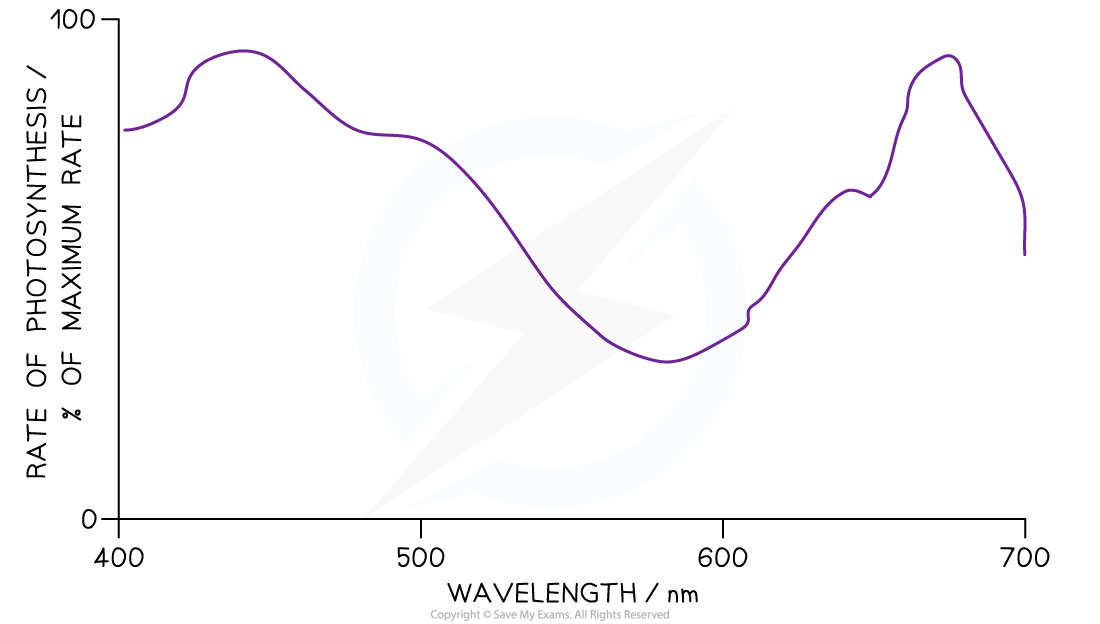
Step 2: Sketch the Curve. An absorbance spectrum for photosynthesis (colour range labels are not required)
Exam Tip
Remember – the pigments themselves have a distinctive colour. This is different from the colours of light that they absorb.Key points to remember:
- Label 400 - 700nm on the x-axis, in 100nm increments
- Use a % scale on the y-axis
- Smooth curve
- Peaks at either end
- Trough in the middle for green light
Investigating Photosynthesis
- An aquatic plant such as Elodea or Camboba is a good choice for investigating photosynthesis in plants, because the rate of photosynthesis can be measured by counting oxygen bubbles that come off a cutting of this plant
- Oxygen output from terrestrial plants (that grow on land) would not be observable
NOS: Experimental design - controlling relevant variables in photosynthesis experiments is essential
- When designing an experiment it is crucial that all variables (apart from the independent and dependent variables being investigated) are controlled
- The independent variable is the factor that is deliberately manipulated between a specific range throughout the experiment
- The dependent variable is the factor that is measured during the experiment (to see if it is affected by the changes to the independent variable)
Other variables must be controlled so that it can be said the independent variable is the only factor affecting the dependent variable during the experiment
- Changes in light intensity, carbon dioxide concentration and temperature are all limiting factors that affect the rate of photosynthesis and can be altered experimentally to measure the effect on the rate of photosynthesis
Effect of light intensity - experimental design
- Basic Experimental Setup
- Aquatic plant cutting in water
- Powdered sodium hydrogencarbonate (NaHCO3)
- Glass funnel
- Boiling tube
- Lamp for illumination
- Glass tank filled with water
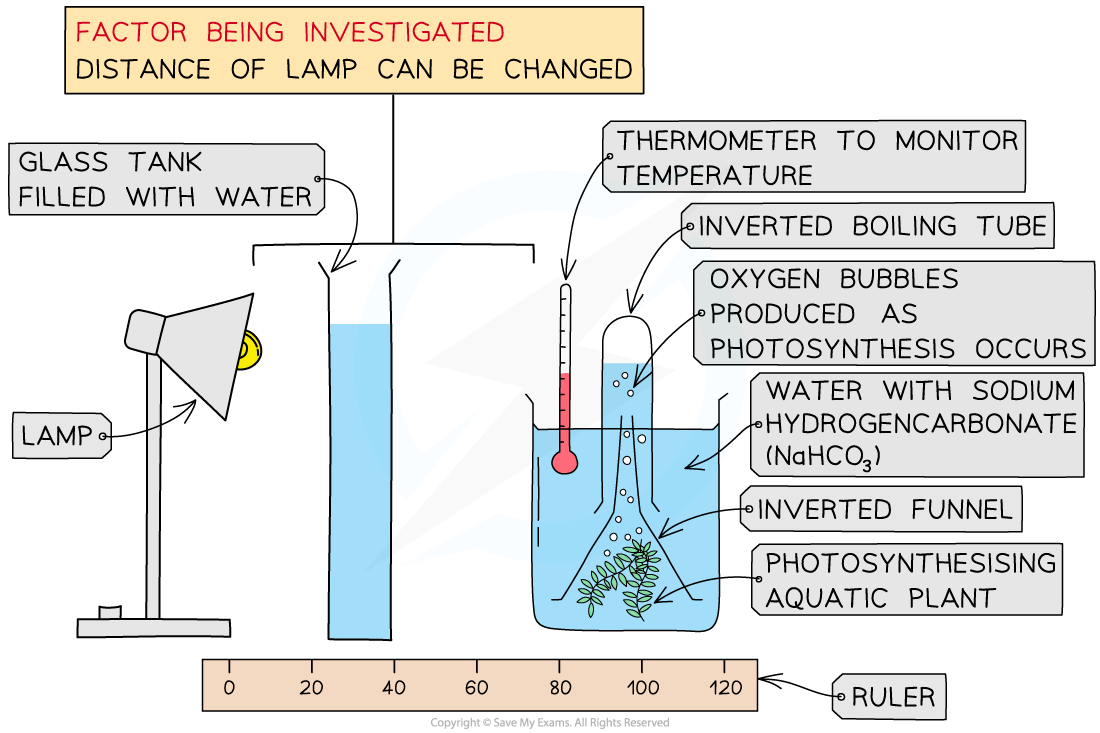
Measuring the Effect of Light Intensity on the Rate of Photosynthesis in Pondweed
Research Question
Does the rate of photosynthesis (number of bubbles released per min) of Elodea increase as the light intensity increases?
Method
- Place a piece of aquatic plant (Elodea or Cabomba are often used), into a beaker of water
- Use a light a set distance from the plant
- Record the number of bubbles observed in three minutes
- Repeat steps for different distances
Improvements
- Use a gas syringe to collect and measure the volume of gas produced
- For reliability of data, repeat the experiment at least twice for each distance and calculate the mean number of bubbles
- Use of a data logger to measure results continuously
Variables to Be Controlled
- Temperature
- The glass tank filled with water absorbs any heat that is emitted from the lamp
- Modern LED bulbs can be used as they give off less heat than filament bulbs
CO2 concentration
- The water used around the plant is first boiled and re-cooled to remove any dissolved carbon dioxide
- A set mass of sodium hydrogencarbonate is added to the water that surrounds the plant
- To make the concentration approx. 0.1 mol dm-3, which is not a limiting concentration
Results
- A graph of the number of bubbles produced per minute against the distance between the lamp and the plant used can be drawn to see the pattern or trend
- Distance between the lamp and the plant is linked to the light intensity
A graph of distance from the lamp against number of bubbles per minute
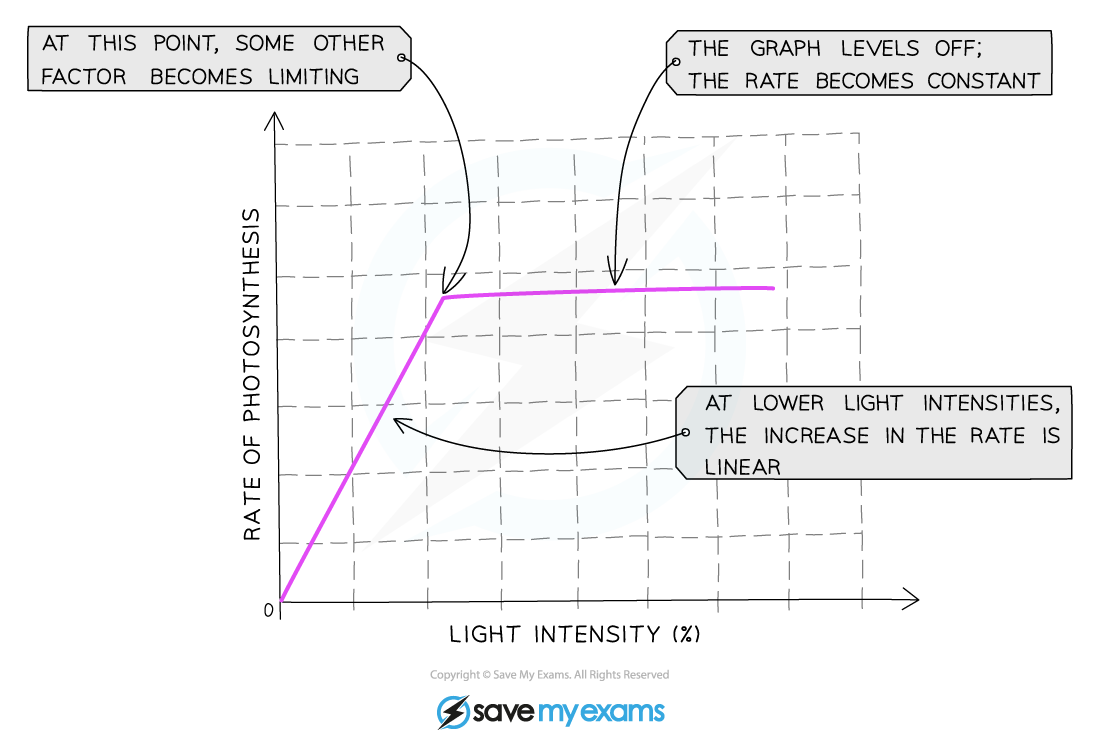
The effect of light intensity on the rate of photosynthesis
Carbon dioxide concentration
- The same basic experimental setup can be used, but with varying use of the following variables
- Start with boiled and re-cooled water as before
- Add successive masses of sodium hydrogencarbonate to increase the concentration in increments of 0.01 mol dm-3, and record the rate of photosynthesis in bubbles minute-1
- Keep the temperature constant at 25°C using a water bath, monitoring with a thermometer in the water surrounding the aquatic plant
- Keep the light intensity constant by keeping the lamp a fixed distance from the plant
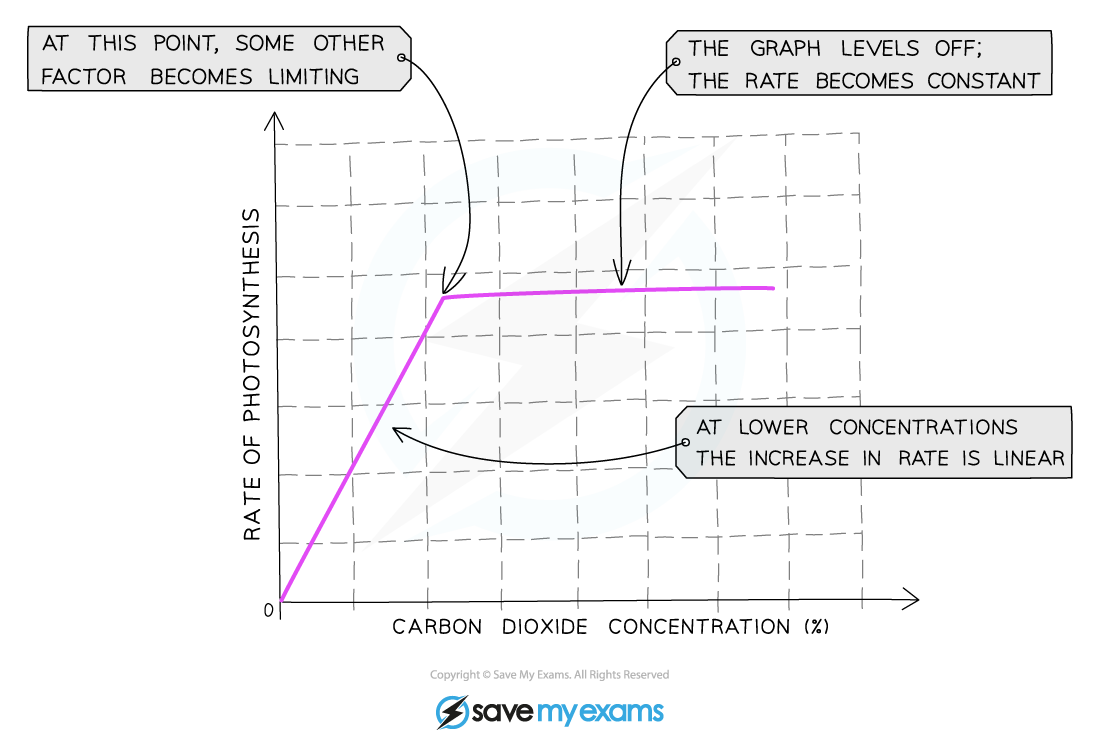
The effect of carbon dioxide concentration on the rate of photosynthesis
Temperature
- The same basic experimental setup can be used, but with varying use of the following variables
- Start with boiled and re-cooled water as before, with sodium hydrogencarbonate at a fixed concentration of 0.1 mol dm-3, and record the rate of photosynthesis in bubbles minute-1
- Vary the temperature from 5°C to 50°C using water baths, monitoring with a thermometer in the water surrounding the plant
- Keep the light intensity constant by keeping the lamp a fixed distance from the plant
- The rate will tail off after around 40°C due to the denaturation of important proteins involved in photosynthesis
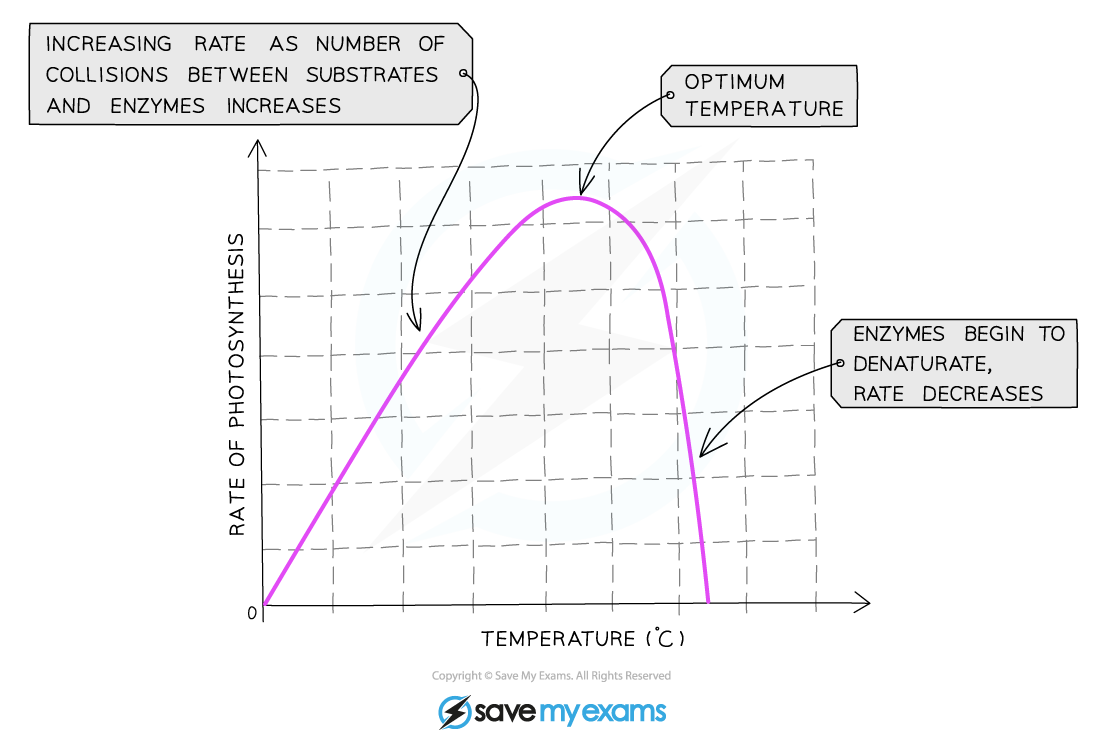
The effect of temperature on the rate of photosynthesis
Exam Tip
The key to this part of the spec is to appreciate how an experimental investigation can be controlled so that any effects we observe are directly due to the one variable that we are deliberately changing.
转载自savemyexams
以上就是关于【IB DP Biology: HL复习笔记2.8.3 Skills: Photosynthesis】的解答,如需了解学校/赛事/课程动态,可至翰林教育官网获取更多信息。
往期文章阅读推荐:
翰林独家 | 经济学竞赛核心精讲,一册打通NEC/IEO/USAEBO!
2026 AMC10/12美国数学竞赛新赛季!【翰林教育 × 清华大学出版社】独家教材全面发售!


翰林AMC8视频课重磅上线!

国际竞赛真题资源免费领取






