AQA A Level Physics复习笔记1.2.3 Determining Uncertainties from Graphs

Using Error Bars
- The uncertainty in a measurement can be shown on a graph as an error bar
- This bar is drawn above and below the point (or from side to side) and shows the uncertainty in that measurement
- Error bars are plotted on graphs to show the absolute uncertainty of values plotted
- Usually, error bars will be in the vertical direction, for y-values, but can also be plotted horizontally, for x-values
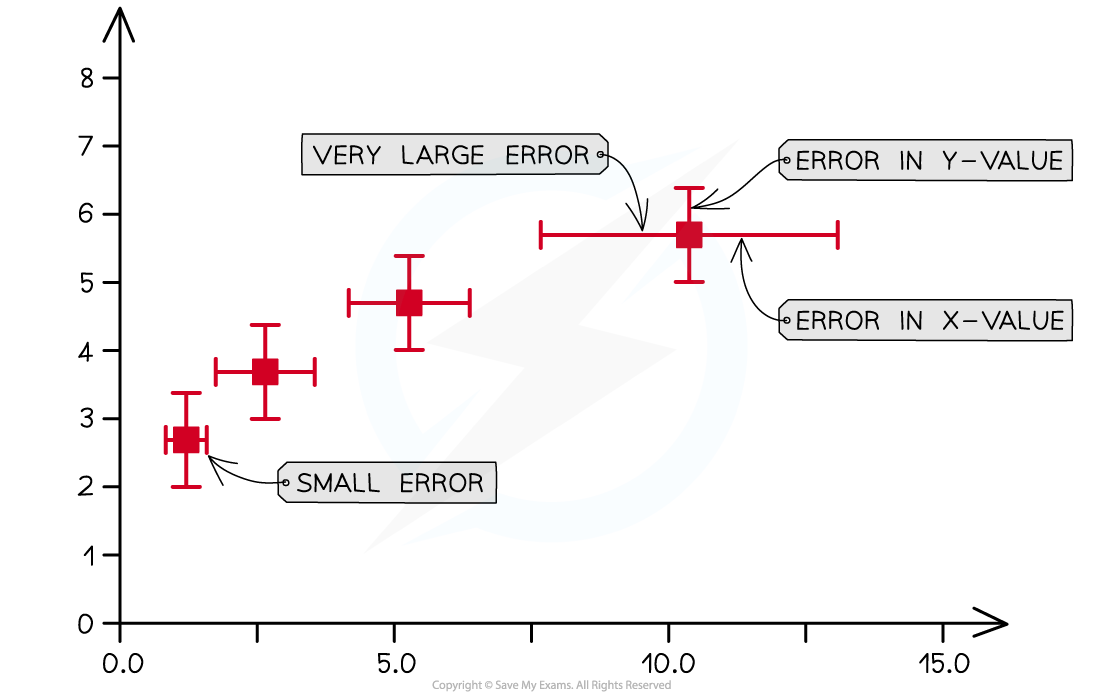
Representing error bars on a graph
Determining Uncertainties from Graphs
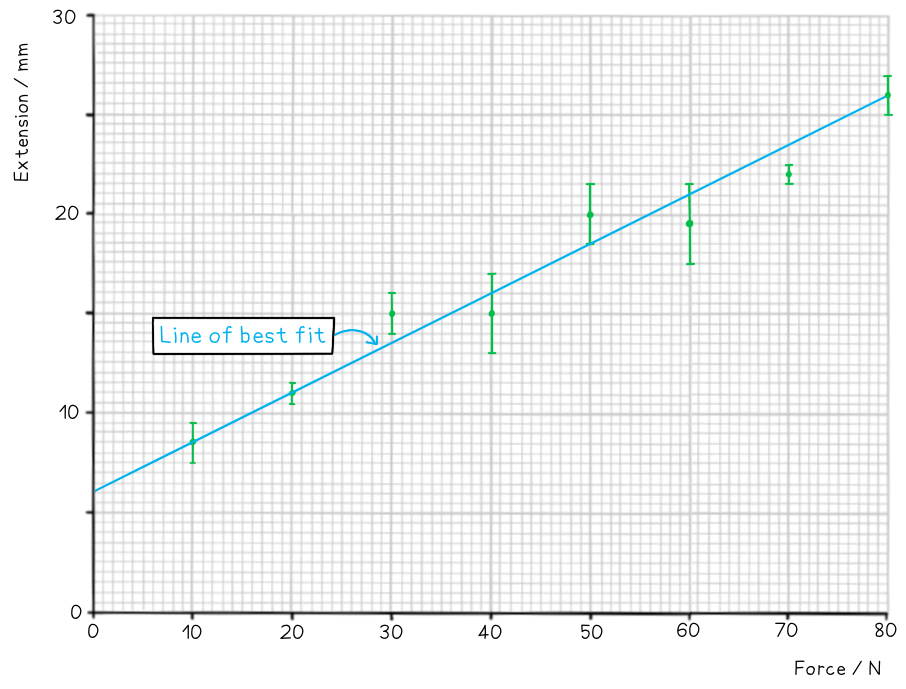
- To calculate the uncertainty in a gradient, two lines of best fit should be drawn on the graph:
- The ‘best’ line of best fit, which passes as close to the points as possible
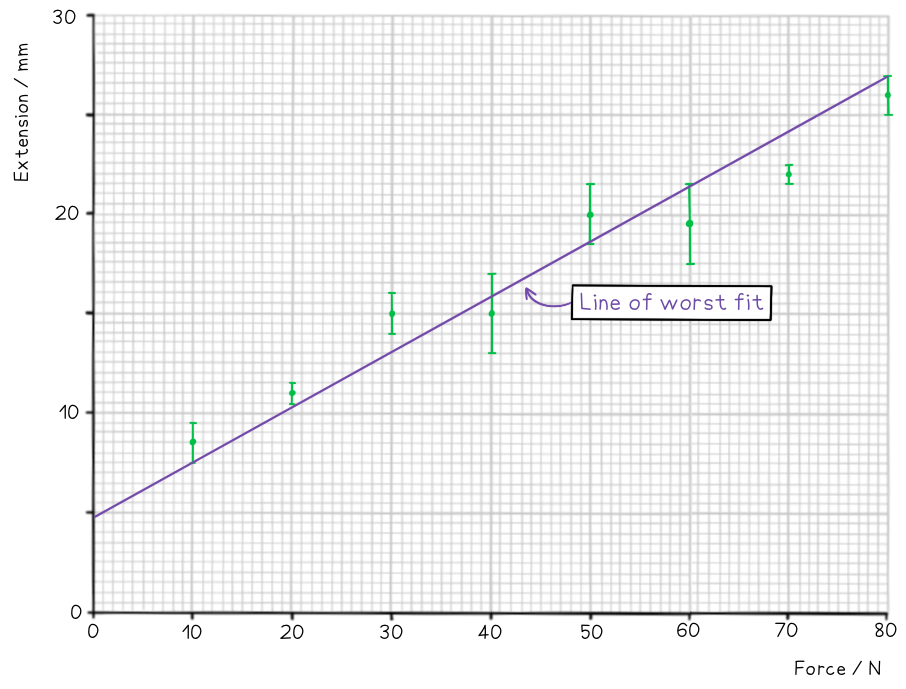
- The ‘worst’ line of best fit, either the steepest possible or the shallowest possible line which fits within all the error bars
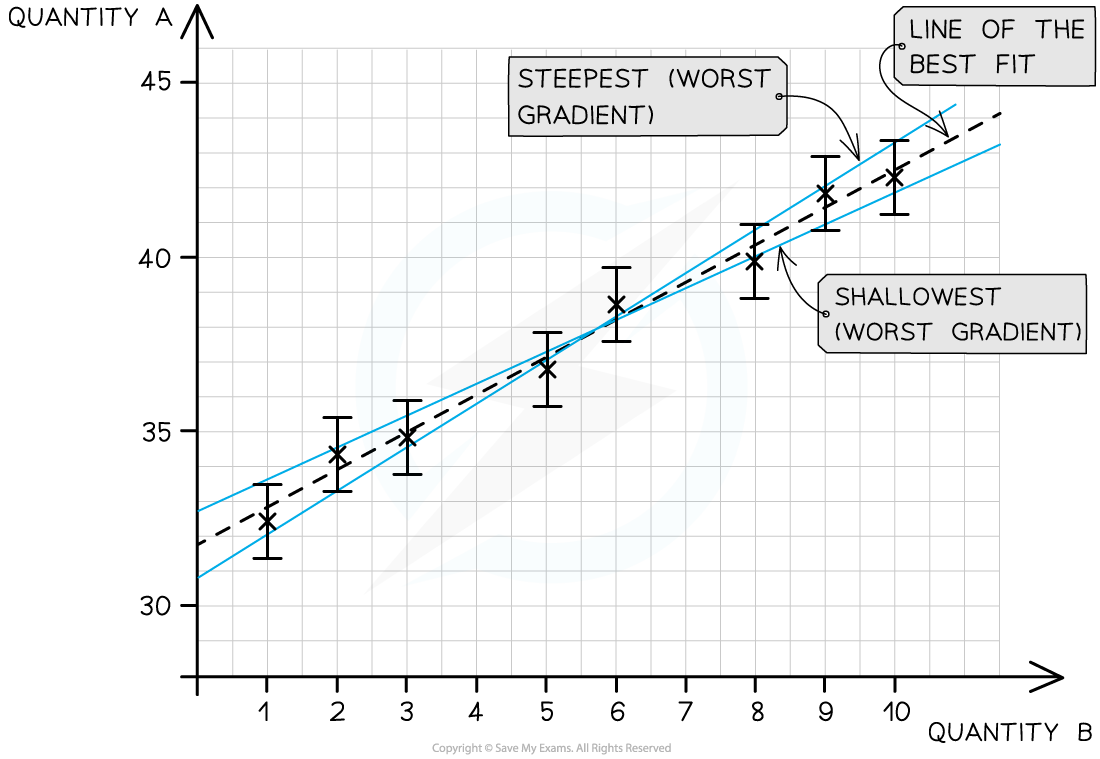
The line of best fit passes as close as possible to all the points. The steepest and shallowest lines are known as the worst fit
- The percentage uncertainty in the gradient can be found using:

- The percentage uncertainty in the y-intercept can be found using:

Worked Example
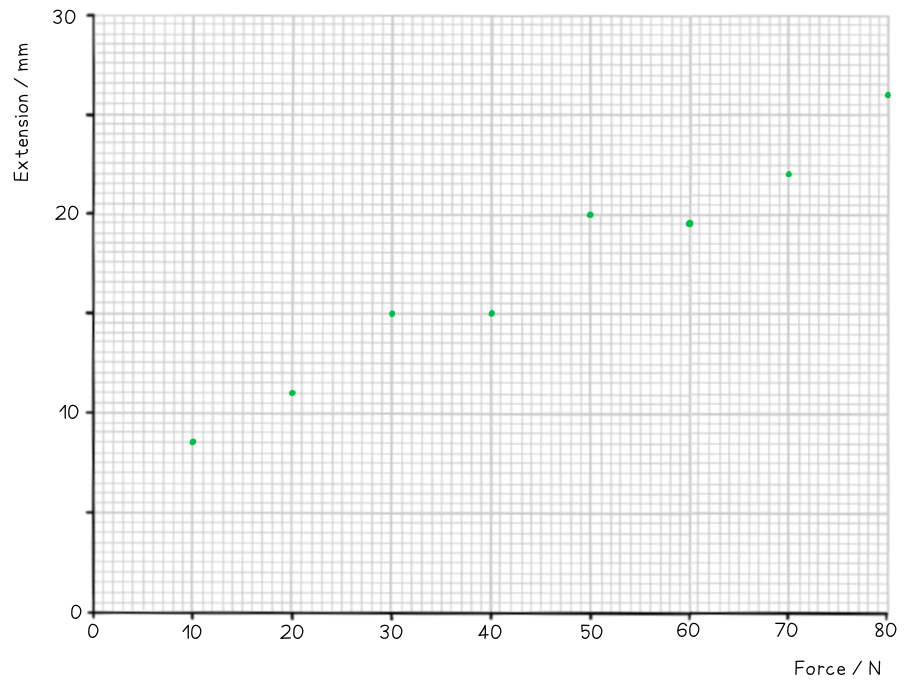
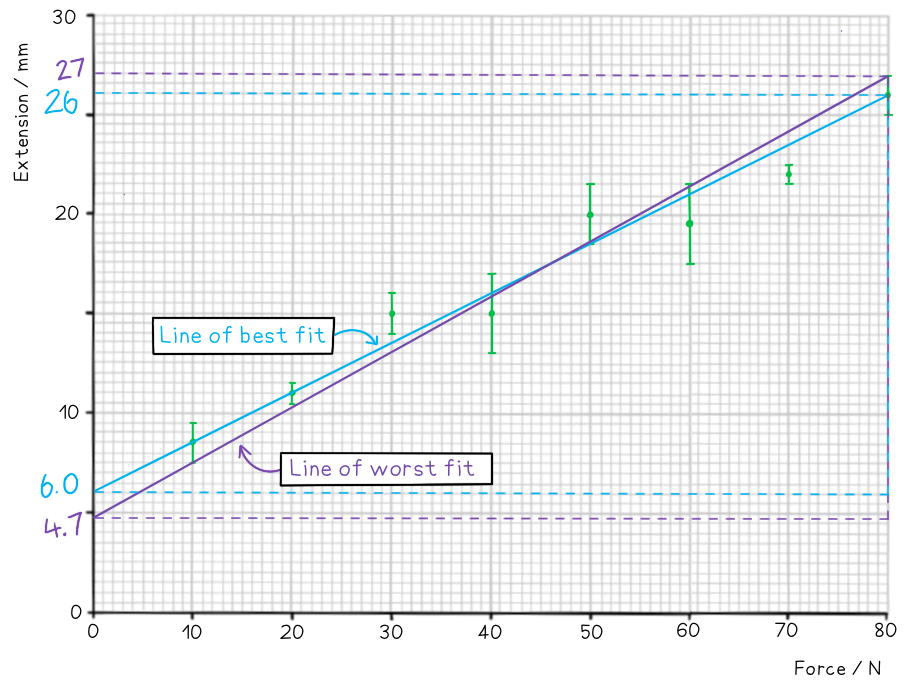
On the axes provided, plot the graph for the following data and draw error bars and lines of best and worst fit.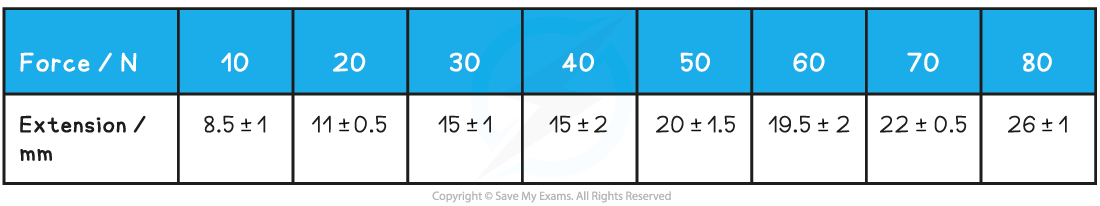 Find the percentage uncertainty in the gradient from your graph.
Step 1: Draw sensible scales on the axes and plot the data
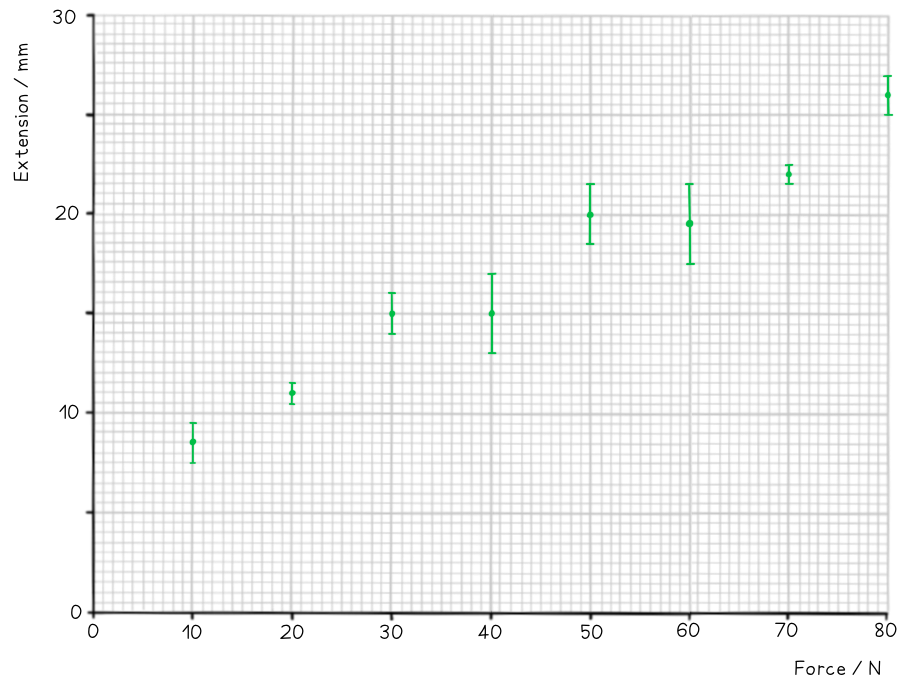
Step 2: Draw the errors bars for each point
Step 3: Draw the line of best fit
Step 4: Draw the line of worst fit
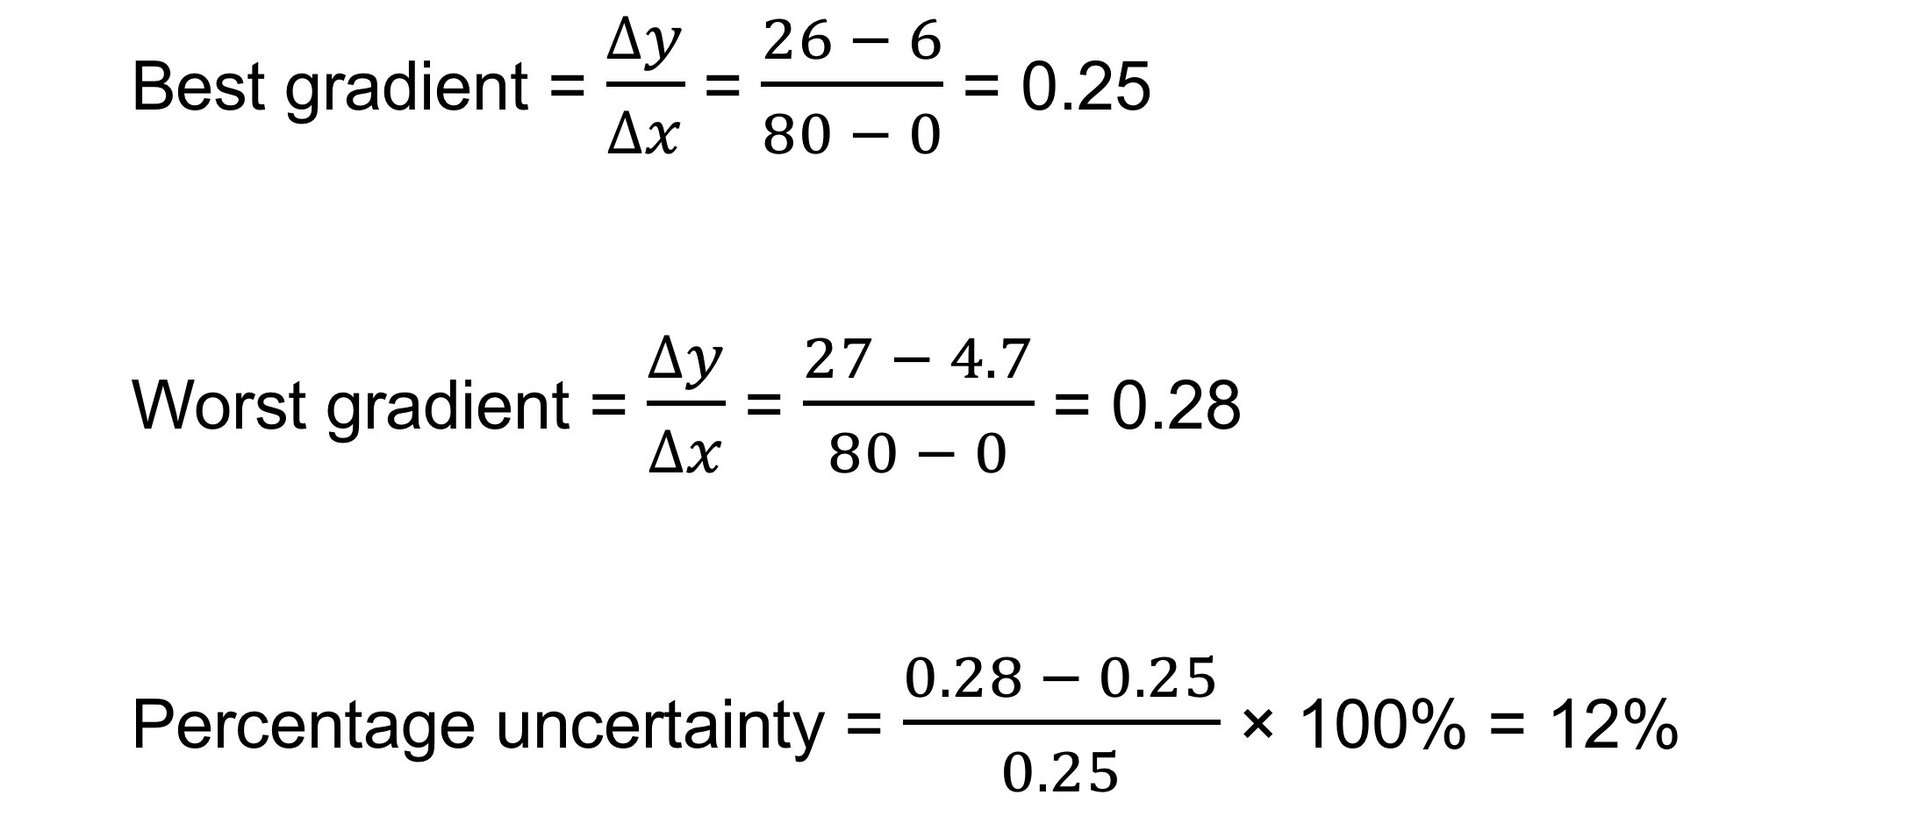
Step 5: Work out the gradient of each line and calculate the percentage uncertainty
Exam Tip
When drawing graphs make sure to follow these rules to gain full marks:
- Ensure the scale is sensible and takes up as much paper as possible
- Label the axes with a quantity and a unit
- Precisely plot the points to within 0.5 squares
- Leave a roughly equal number of points above and below the best fit line
- Draw the error bars accurately
转载自savemyexams
以上就是关于【AQA A Level Physics复习笔记1.2.3 Determining Uncertainties from Graphs】的解答,如需了解学校/赛事/课程动态,可至翰林教育官网获取更多信息。
往期文章阅读推荐:
全网破防!ALevel CIE数学M1疑似错题?经济P2难度飙升?5月6日大考考情分析必看!
A-Level CIE就大规模泄题发布最严处罚!哪些考生必须重考?你的成绩怎么办?

翰林AMC8视频课重磅上线!

国际竞赛真题资源免费领取


