2022HIMCM全球高中生数模赛B题

2022HiMCM全球高中生数模赛B题全文如下
Problem B:CO2 and Global Warming
Prior to the Industrial Revolution, carbon dioxide (CO2) in the atmosphere was consistently around 280 parts per million (ppm). The concentration of CO2 in the atmosphere reached 377.7 ppm
in March of 2004, resulting in the largest 10-year average increase up to that time.[1] According to scientists from National Oceanographic and Atmospheric Administration (NOAA) and Scripps Institution of Oceanography (SIO) the monthly mean CO2 concentration level peaked at 421 ppm in May 2022.[2] An Organisation for Economic Co-Operations and Development (OECD) report predicts a CO2 level of 685 ppm by 2050.[3]
The editors of Scientific Today magazine have asked your team to address these claims of the current reported and future predictions of CO2 concentration levels. They provided two data sets (CO2 Data Set 1 & Temps Data Set 2) to assist in your research.
Requirements
1. Do you agree with CO2 level claims? Use CO2 Data Set 1 to analyze CO2 changes.
a. Do you agree that the March 2004 increase of CO2 resulted in a larger increase than observed over any previous 10-year period? Why or why not?
b. Fit various (more than one) mathematical models to the data to describe past, and predict future, concentration levels of CO2 in the atmosphere.
c. Use each of your models to predict the CO2 concentrations in the atmosphere in the year 2100. Do any of your models agree with claims and predictions that the CO2 concentration level will reach 685 ppm by 2050? If not by 2050, when do your models predict the concentration of CO2 reaching 685 ppm?
d. Which model do you consider most accurate? Why?
2. What’s the relationship between temperature and CO2? Many scientists think that there is a relationship between warming global temperatures and the concentration of CO2 in the atmosphere. Use your work in part 1 and Temps Data Set 2 to assist in your comparison of land-ocean temperatures and CO2 concentration levels.
a. Build a model to predict future land-ocean temperatures changes. When does your model predict the average land-ocean temperature will change by 1.25°C, 1.50°C, and 2°C compared to the base period of 1951-1980?
b. Build a model to analyze the relationship (if any) between CO2 concentrations and landocean temperatures since 1959. Explain the relationship or justify that there is no relationship.
c. Extend your model from part 2.b. into the future. How far into the future is your model reliable? What concerns, if any, do you have with your model’s ability to predict future CO2 concentration levels and/or land-ocean temperatures?
3. Prepare a non-technical article (1 page maximum) for Scientific Today to explain in your team’s findings and possible recommendations for the future.
Your PDF solution of no more than 25 total pages should include:
One-page Summary Sheet.
Table of Contents.
Your complete solution.
One-page non-technical Article.
References list.
Note: The HiMCM Contest has a 25-page limit. All aspects of your submission count toward the 25-page limit (Summary Sheet, Table of Contents, Reference List, Article, and any Appendices).
Attachment
2022_HiMCM_Data.xlsx
Sheet 1: CO2 Data Set 1
Sheet 2: Temps Data Set 2
References
[1] National Oceanographic and Atmospheric Administration. NOAA Earth System Research Laboratory. (2022, October). Trends in atmospheric carbon dioxide [Internet].
https://gml.noaa.gov/ccgg/trends/data.html.
[2] National Oceanographic and Atmospheric Administration. NOAA Research News & Features. (2022, June 3). Carbon dioxide now mare than 50% higher than pre-industrial levels [Internet].
https://www.noaa.gov/news-release/carbon-dioxide-now-more-than-50-higher-than-pre-industriallevels.
[3] Organisation for Economic Co-Operations and Development. (2012). The OECD environmental outlook to 2050 [Internet].
https://www.oecd.org/env/cc/Outlook%20to%202050_Climate%20Change%20Chapter_HIGLIGH TS-FINA-8pager-UPDATED%20NOV2012.pdf.
CO2 Data Set 1: Annual month of March averages of CO2 expressed as a mole fraction in dry air, micromole/mol, abbreviated PPM (parts per million) derived from continuous air samples for the Mauna Loa Observatory, Hawaii, U.S.A.
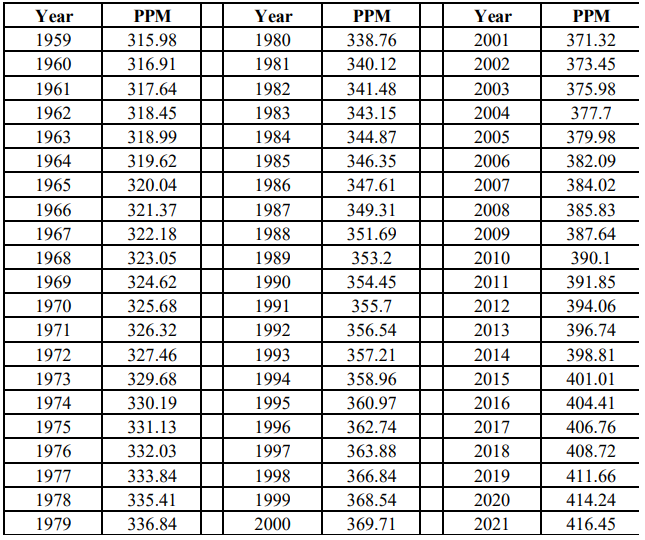
Data Source Credit: National Oceanographic and Atmospheric Administration (NOAA) GML Data and Scripps Institution of Oceanography (SIO).
https://gml.noaa.gov/webdata/ccgg/trends/co2/co2_annmean_mlo.txt.
Temps Data Set 2: Global annual mean surface-air temperature change in degrees Celsius based on land and ocean data compared to the temperature mean of the base period 1951-1980. For example, in 2021, the global land and sea temperature was 0.84°C above the temperature mean of the base period of 1951-1980.
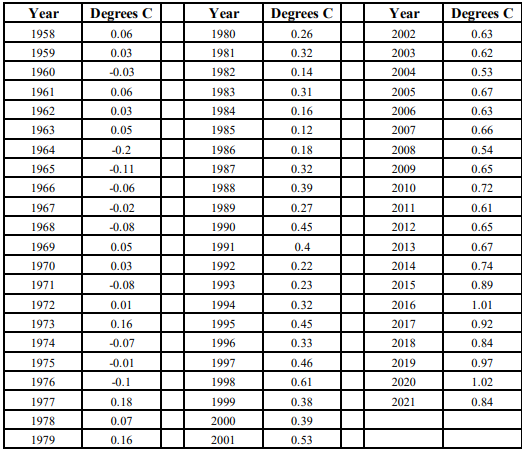
Data Source Credit: National Aeronautics and Space Administration Goddard Institute for Space Studies.
GISTEMP Team, 2022: GISS Surface Temperature Analysis (GISTEMP), version 4. NASA Goddard Institute for Space Studies. Dataset accessed 2022-10-18 at data.giss.nasa.gov/gistemp/.
Lenssen, N., G. Schmidt, J. Hansen, M. Menne, A. Persin, R. Ruedy, and D. Zyss, 2019: Improvements in the GISTEMP uncertainty model. J. Geophys. Res. Atmos., 124, no. 12, 6307-6326, doi:10.1029/2018JD029522.
以上就是关于【2022HIMCM全球高中生数模赛B题】的解答,如需了解学校/赛事/课程动态,可至翰林教育官网获取更多信息。
往期文章阅读推荐:


翰林AMC8视频课重磅上线!

国际竞赛真题资源免费领取


