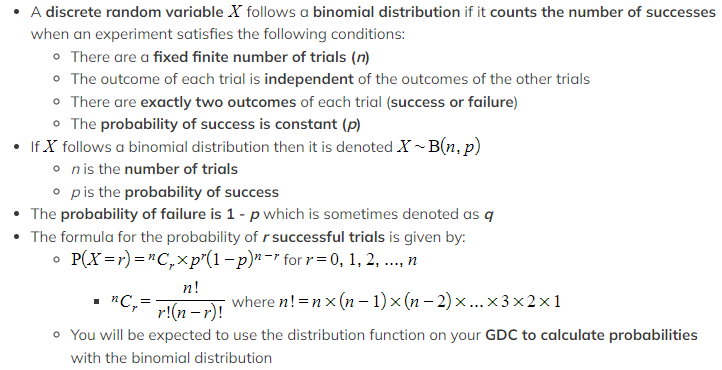
AQA A Level Physics复习笔记7.7.2 The Time Constant
The Time Constant The time constant of a capacitor discharging through a resistor is a measure of how long it takes for the capacitor to discharge The definition of the time constant is: The...
Venn Diagrams What is a Venn diagram? A Venn diagram is a way to illustrate events from an experiment and are particularly useful when there is an overlap between possible outcomes A Venn diagram c...
Bayes' Theorem What is Bayes’ Theorem How do I calculate conditional probabilities using Bayes’ Theorem? Start by drawing a tree diagram Label B1 & B2 (& B3 if necessary) on the first set o...
Conditional Probability What is conditional probability? Conditional probability is where the probability of an event happening can vary depending on the outcome of a prior event The event A happen...
Probability Basics What key words and terminology are used with probability? An experiment is a repeatable activity that has a result that can be observed or recorded Trials are what we call the re...
补录是英国大学在本科正式申请截止后释放出还未满额的专业,供学生做最后的申请。 2022英国本科补录有好学校吗?补录开放时间为7月5日至10月18日。如果你没有拿到任何英国大学的录取(或是不满意目前的录取),你...
2022年全球宜居城市排名已经发布,墨尔本是唯一进入前10名的澳洲城市,也是澳洲最宜居的城市。该榜单由经济学人智库(EIU)发布,从2011年到2017年,墨尔本一直位居榜首。墨尔本除了八大,都有哪些宝藏大学? 1. ...
今天小编带大家了解一下约翰霍普金斯大学Carey商学院项目分析,盘点一下具体的项目时长、必修选修科目等等。约翰霍普金斯大学在2022US News世界排名第九,也是很多同学们的Dream School啦~ Carey商学院项目分析 B...
PMCC What is Pearson’s product-moment correlation coefficient? Pearson’s product-moment correlation coefficient (PMCC) is a way of giving a numerical value to a linear relationship of bivariate dat...
Scatter Diagrams What does bivariate data mean? Bivariate data is data which is collected on two variables and looks at how one of the factors affects the other Each data value from one variable wi...
Interpreting Data How do I interpret statistical measures? The mode is useful for qualitative data It is not as useful for quantitative data as there is not always a unique mode The mean includes a...
Univariate data is data that is in one variable. Box Plots What is a box plot (box and whisker diagram)? A box plot is a graph that clearly shows key statistics from a data set It shows the median,...
© 2025. All Rights Reserved. 沪ICP备2023009024号-1