- 翰林提供学术活动、国际课程、科研项目一站式留学背景提升服务!
- 400 888 0080
Edexcel A Level Maths: Statistics:复习笔记2.4.1 Correlation & Regression
Scatter Diagrams
What does bivariate data mean?
- A lot of statistics is about looking at how different factors, or variables change how data behaves
- Bivariate data is data which is collected on two variables and looks at how one of the factors affects the other
- Each data value from one variable will be paired with a data value from the other variable
- The two variables are often related, but do not have to be
What is a scatter diagram?
- A scatter diagram is a way of graphing bivariate data
- You may be asked to plot, or add to, a scatter diagram
- One variable will be on the
 – axis and the other will be on the
  – axis
 - The variable that can be controlled in the data collection is known as the independent or explanatory variable and is plotted on the
 – axis
 - The variable that is measured or discovered in the data collection is known as the dependent or response variable and is plotted on the
 – axis
- Scatter diagrams allow statisticians to look for relationships between the two variables
- Some scatter diagrams will show a clear relationship know as correlation (see below)
- Others will not display on obvious relationship
- If a scatter diagram shows a relationship you may be asked to identify outliers
Worked Example
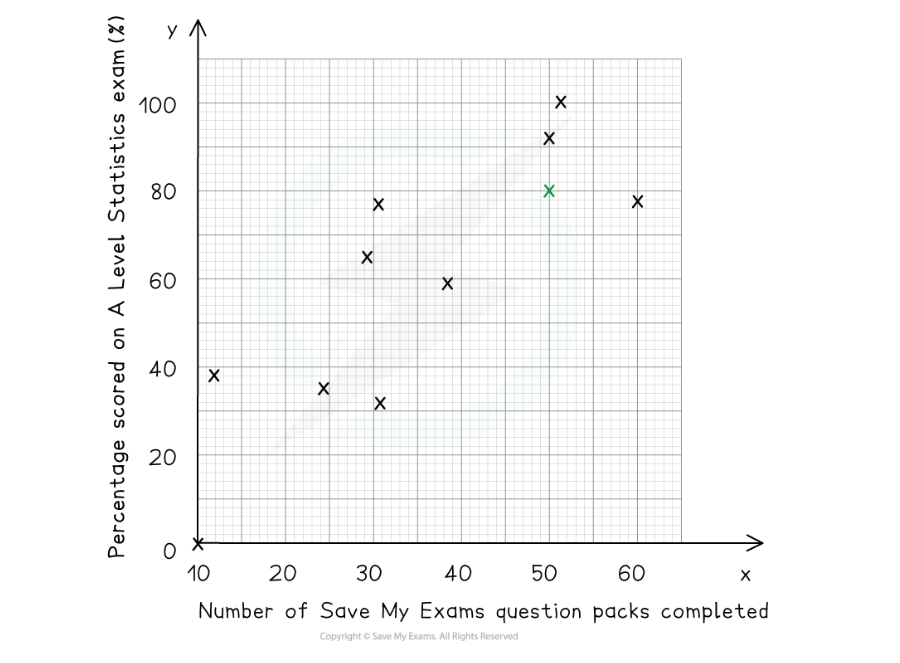
The scatter diagram below shows the number of Save My Exams question packs completed by a group of students and the percentage score they received in their A-Level Statistics exam.
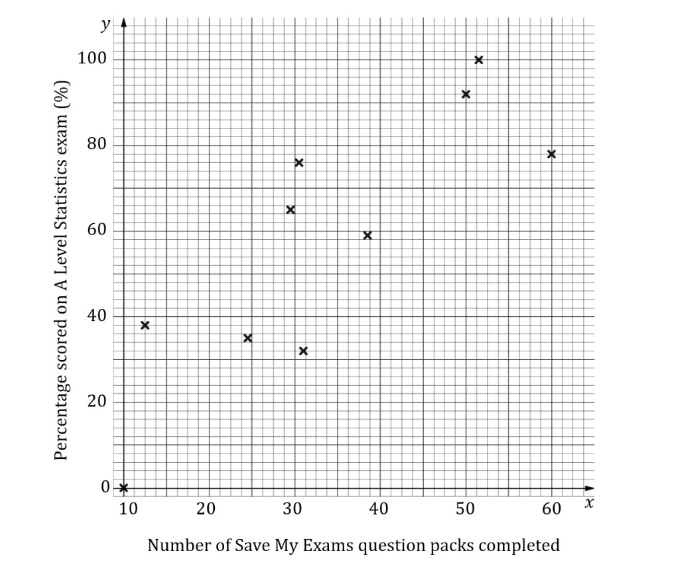
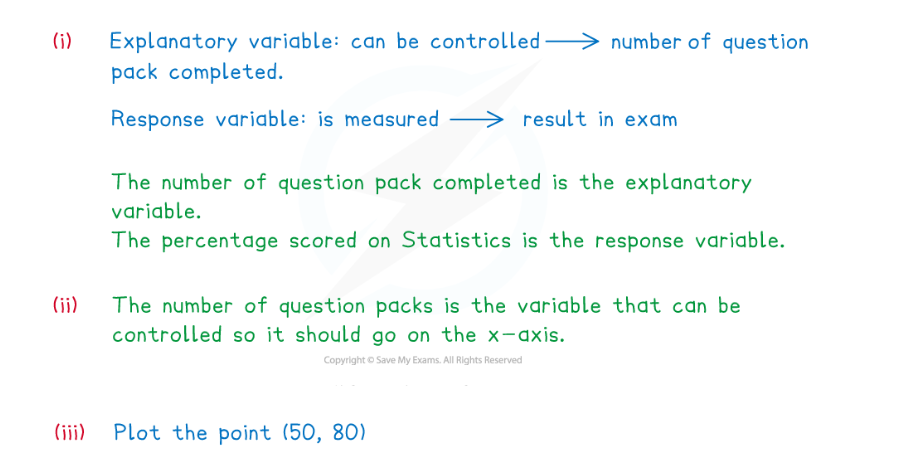
(i) State which of the variables is the explanatory variable and which is the response variable.
(ii) Explain why the number of question packs completed is on the  – axis.
(iii) Another student completed 50 question packs and scored 80% on their A Level Statistics exam, add this data to the scatter diagram.
Exam Tip
- Learn the vocabulary for the types of variables as you could be asked a question on this. Make sure you check the scales carefully when plotting any points.
Correlation
What is correlation?
- Correlation is how the relationship between the two variables is described
- Perfect linear correlation means that the bivariate data will all lie on a straight line on a scatter diagram
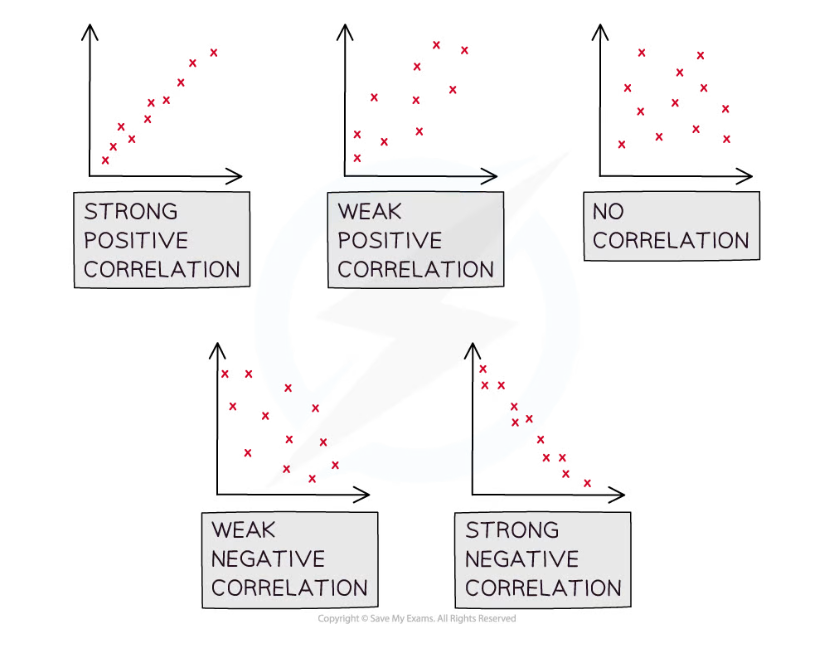
- Linear correlation can be positive or negative and it can be strong or weak
- Positive correlation describes a data set where both variables are increasing
- Negative correlation describes a data set where one variable is increasing and the other is decreasing
- When describing correlation you should say whether it is positive or negative and also say whether it is strong or weak
- If correlation exists then there could be outliers, these will be data points that do not fit the pattern seen on the graph
- There will likely be a maximum of one or two outliers on any scatter diagram
- You may be asked to identify the outliers
What is the difference between correlation and causation?
- It is important to be aware that just because correlation exists, it does not mean that the change in one of the variables is causing the change in the other variable
- Correlation does not imply causation!
- If a change in one variable causes a change in the other then the two variables are said to have a causal relationship
- Observing correlation between two variables does not always mean that there is a causal relationship
- Look at the two variables in question and consider the context of the question to decide if there could be a causal relationship
- If the two variables are temperature and number of ice creams sold at a park then it is likely to be a causal relationship
- Correlation may exist between global temperatures and the number of monkeys kept as pets in the UK but they are unlikely to have a causal relationship
- Observing a relationship between two variables can allow you to create a hypothesis about those two variables
Worked Example
The scatter diagram below shows the number of Save My Exams question packs completed by a group of students and the percentage score they received in their A-Level Statistics exam.
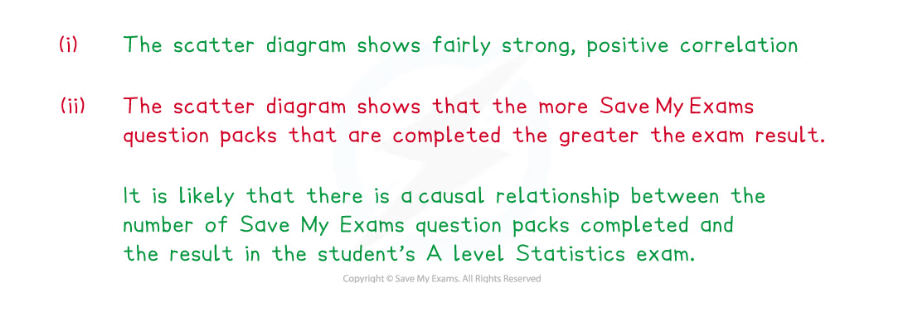
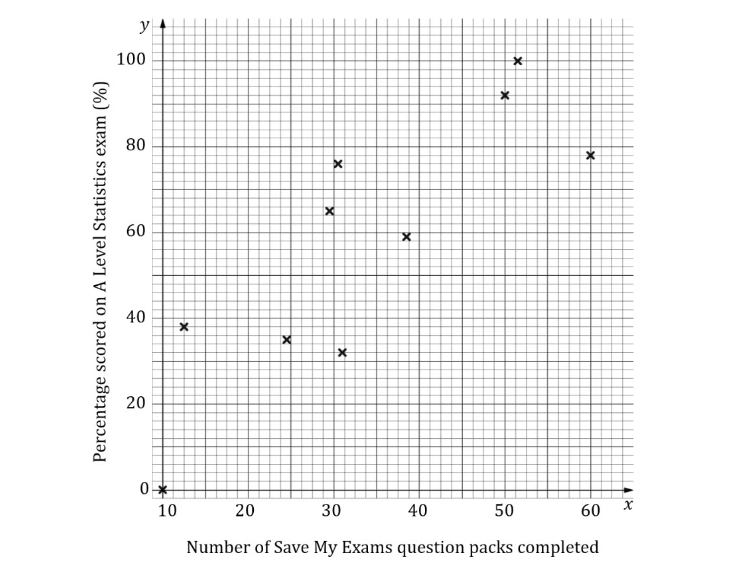 (i)Describe the correlation shown in the scatter diagram.
(ii)Decide if you think there could be a causal relationship between the two variables and explain your reasoning.
Linear Regression
What is linear regression?
- If strong linear correlation exists on a scatter diagram, then a line of best fit can be drawn
- This is a linear graph added to the scatter diagram that best approximates the relationship between the two variables
- At GCSE this will have been drawn by eye as a line that fits closest to the data values
- The data can be used to calculate the equation of the straight line that represents the best fit of the relationship between the two variables
- You do not need to know how to calculate it but you will need to be able to interpret one
- The least squares regression line is the line of best fit that minimises the sum of the squares of the gap between the line and each data value
- This is usually called the regression line and can be calculated either be looking at the vertical or the horizontal distances between the line and the data values
- If the regression line is calculated by looking at the vertical distances it is called the regression line of y on x
- If the regression line is calculated by looking at the horizontal distances it is called the regression line of x on y
- The regression line of x on y is rarely used and you are unlikely to come across it at this level
- The regression line of y on x is written in the form

- b is the gradient of the line and represents the change in for each individual unit change in

- a is the y – intercept and shows the value of
 for which
  is zero
- b is the gradient of the line and represents the change in for each individual unit change in
- You are not expected to calculate the regression line in your exam but you should be prepared to draw one onto a scatter diagram, interpret or use one to predict values
- It is useful to know that the point
 will lie on the regression line
- It is useful to know that the point
How to use a regression line?
- Drawing a regression line is done in the same way as drawing a straight line graph, substitute some values from the independent data set to help you
- The regression line can be used to decide what type of correlation there is if there is no scatter diagram
- If b is positive then the data set has positive correlation and if b is negative then the data set has negative correlation
- The value of b can be used to interpret how the data is changing
- b is the gradient of the line and represents the change in y for each individual unit change in

- b is the gradient of the line and represents the change in y for each individual unit change in
- The regression line can also be used to predict the value of a dependent variable from an independent variable
- Predictions should only be made for values of the dependent variable that are within the range of the given data
- Making a prediction within the range of the given data is called interpolation
- Making a prediction outside of the range of the given data is called extrapolation and is much less reliable
- The prediction will be more reliable if the number of data values in the original sample set is bigger
Worked Example
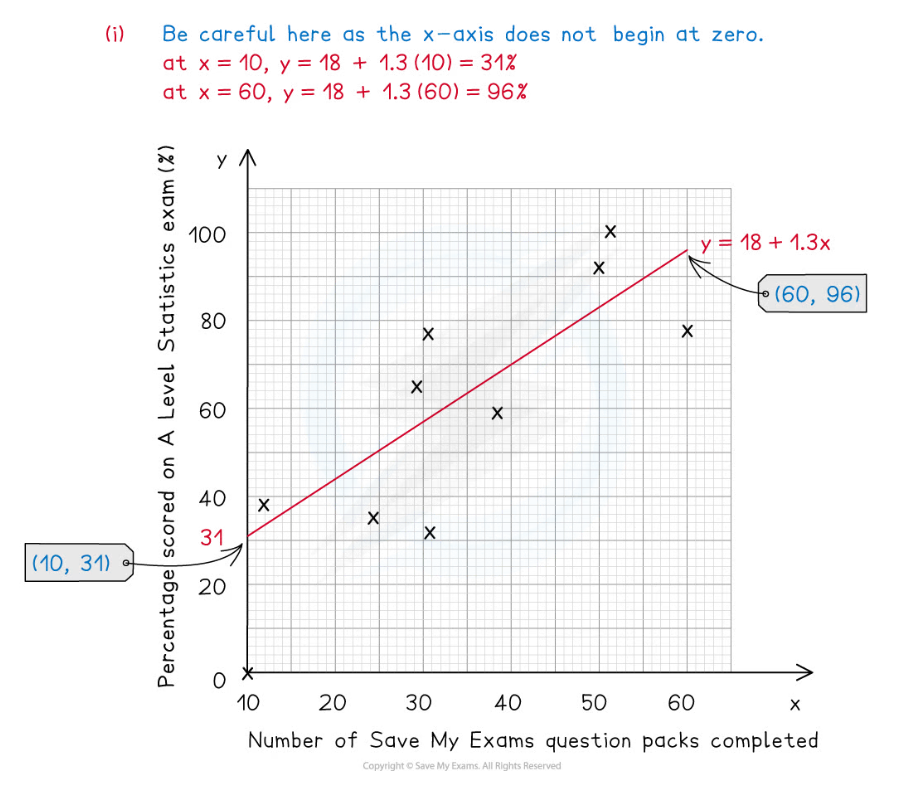
The scatter diagram below shows the number of Save My Exams question packs completed by a group of students, ![]() and the percentage score they received in their A-Level Statistics exam,
and the percentage score they received in their A-Level Statistics exam, ![]() .
.
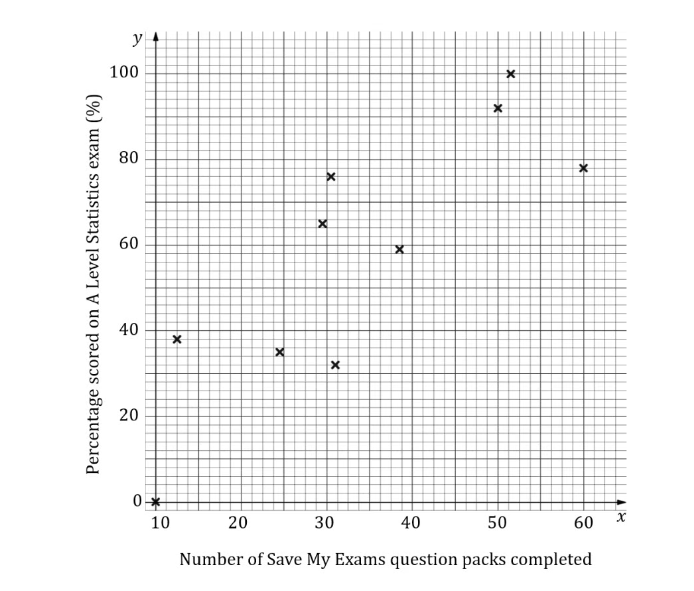
The equation of the regression line of ![]() on
on ![]() is
is ![]()
(i)Draw the regression line onto the scatter diagram.
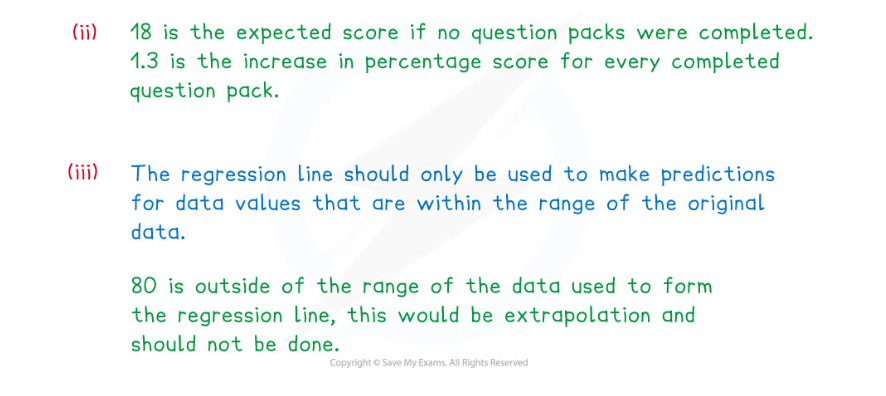
(ii)Interpret the meaning of the values 18 and 1.3 in the scatter diagram.
(iii)Explain why the regression line given should not be used to estimate the percentage when someone has completed 80 question packs.
Exam Tip
- Remember that the value of b is the gradient of the regression line, a greater value of b does not mean stronger correlation. When using a regression line to make a prediction make sure that the value you are predicting from falls within the range of the data used to calculate the regression line.
转载自savemyexams

最新发布
© 2026. All Rights Reserved. 沪ICP备2023009024号-1

