CIE A Level Chemistry复习笔记1.7.13 Indicators used in Titration

Indicators
- Indicators are substances that change colour when they are added to acidic or alkaline solutions
- When choosing the appropriate indicator, the pH of the equivalence point is very important
- The two most common indicators that are used in titrations are methyl orange and phenolphthalein
- Both indicators change colour over a specific pH range
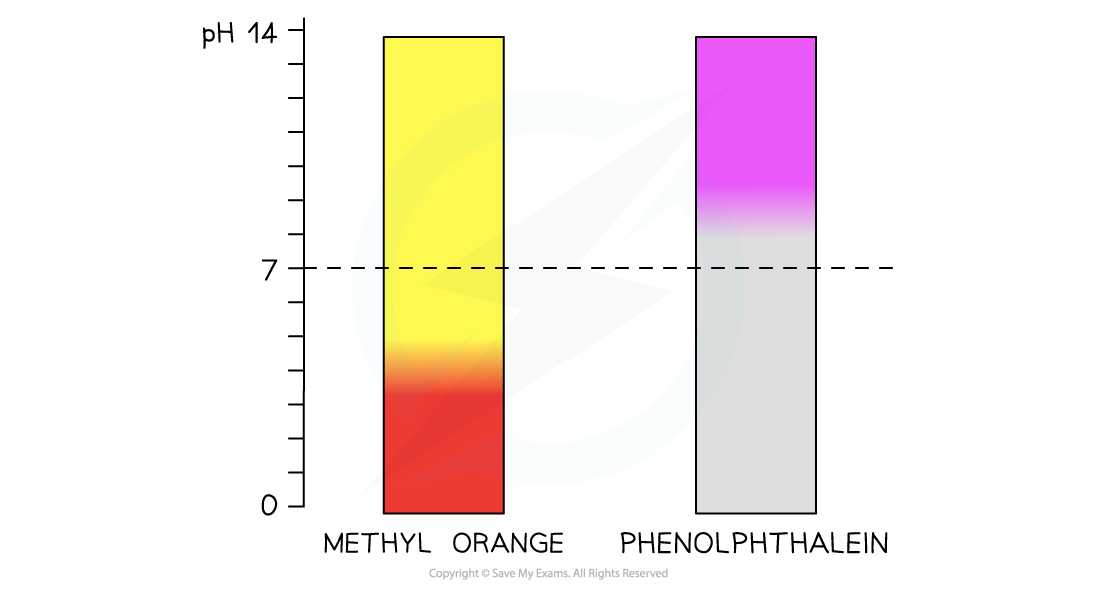
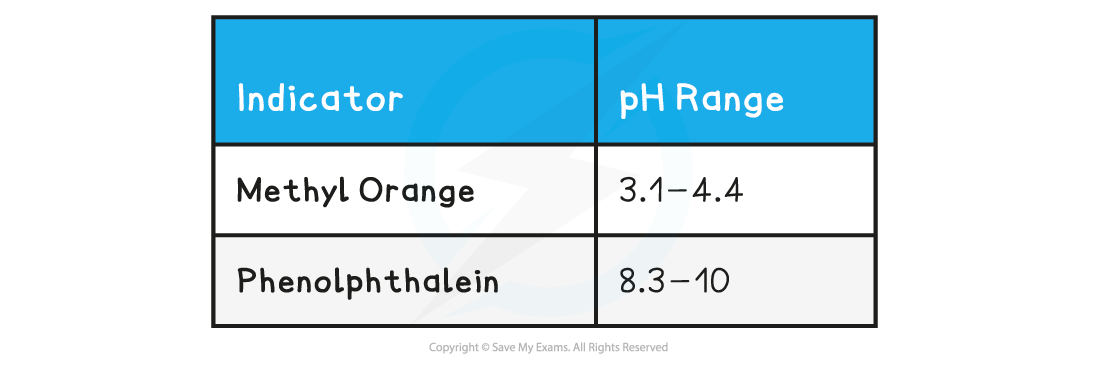
The diagram shows the change in colour from red to yellow of methyl orange over a pH range of 3.1-4.4 and from colourless to pink of phenolphthalein over a pH range of 8.3-10
Indicator & pH range table
Choosing indicators for titrations
- Strong acid and strong alkali
- The colour change for both indicators takes place at a pH range that falls within the vertical region of the curve
- Therefore, either indicator can be used
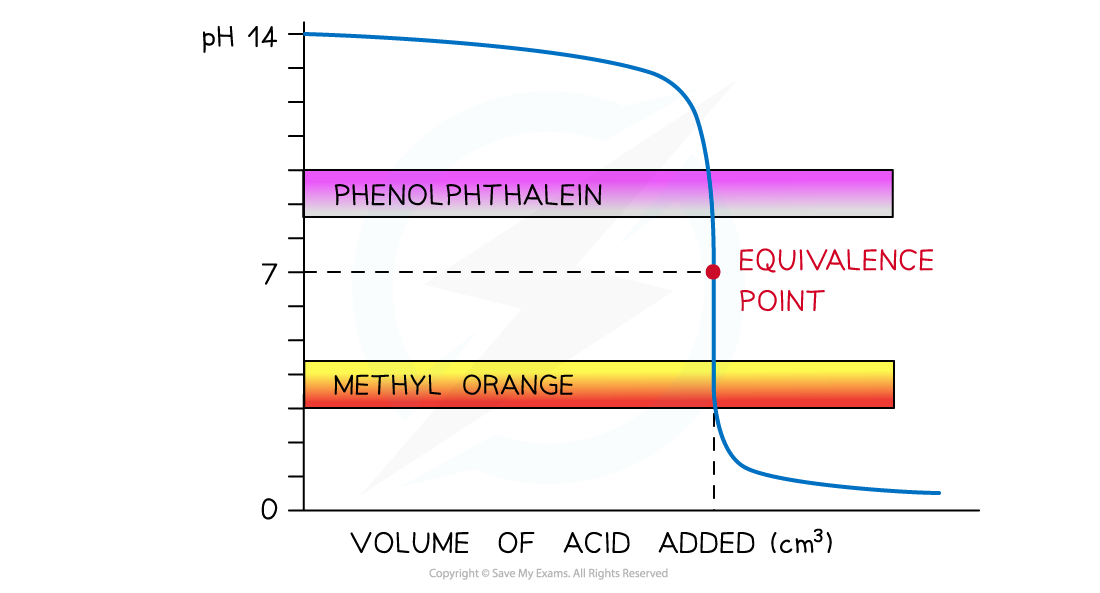
The diagram shows that both indicators can be used to determine the endpoint of the titration of a strong acid and strong alkali
- Strong acid and weak alkali
- Only methyl orange will change colour at a pH close to the equivalence point and within the vertical region of the curve
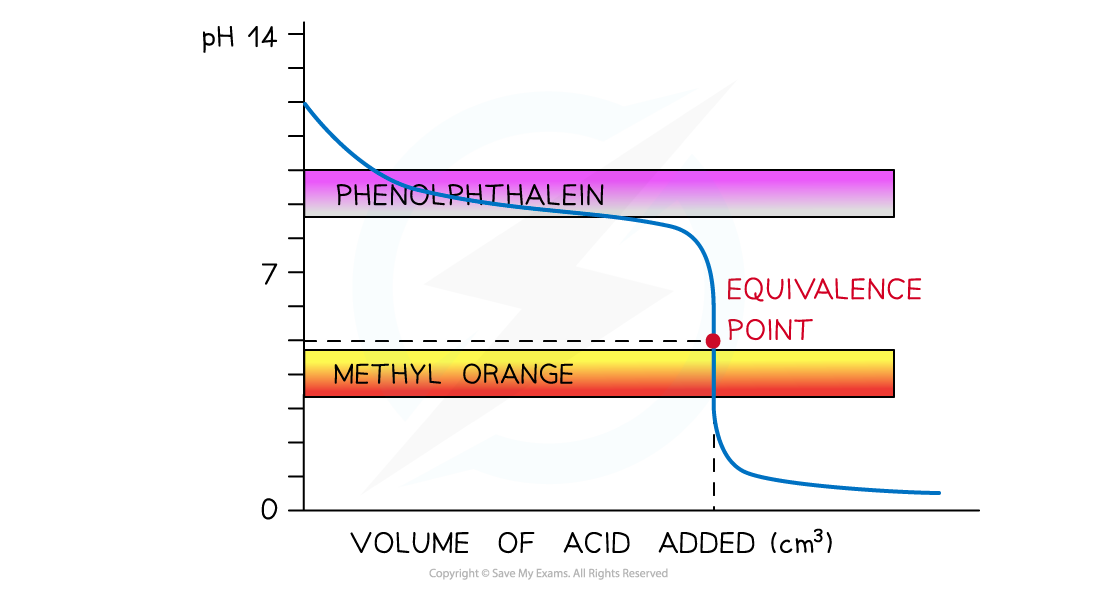
The diagram shows that only methyl orange can be used to determine the endpoint of the titration of a strong acid and weak alkali
- Weak acid and strong alkali
- Now, only phenolphthalein will change colour at a pH close to the equivalence point and within the vertical region of the curve
- The pH range at which methyl orange changes colour falls below the curve
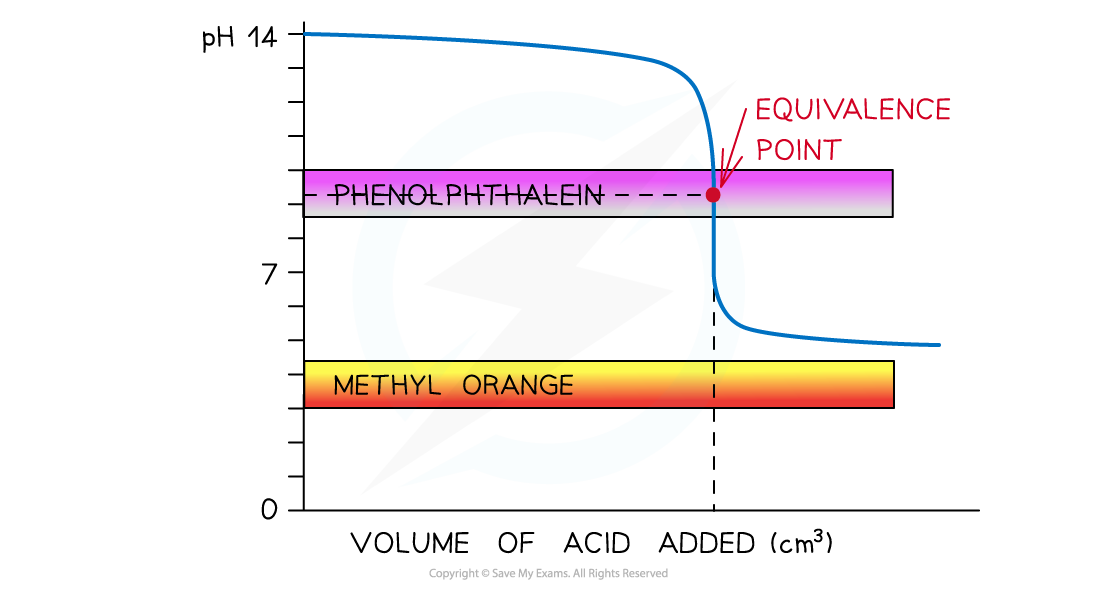 The diagram shows that only phenolphthalein can be used to determine the endpoint of the titration of a weak acid and strong alkali
- Weak acid and weak alkali
- Neither indicator is useful, and a different method should be considered
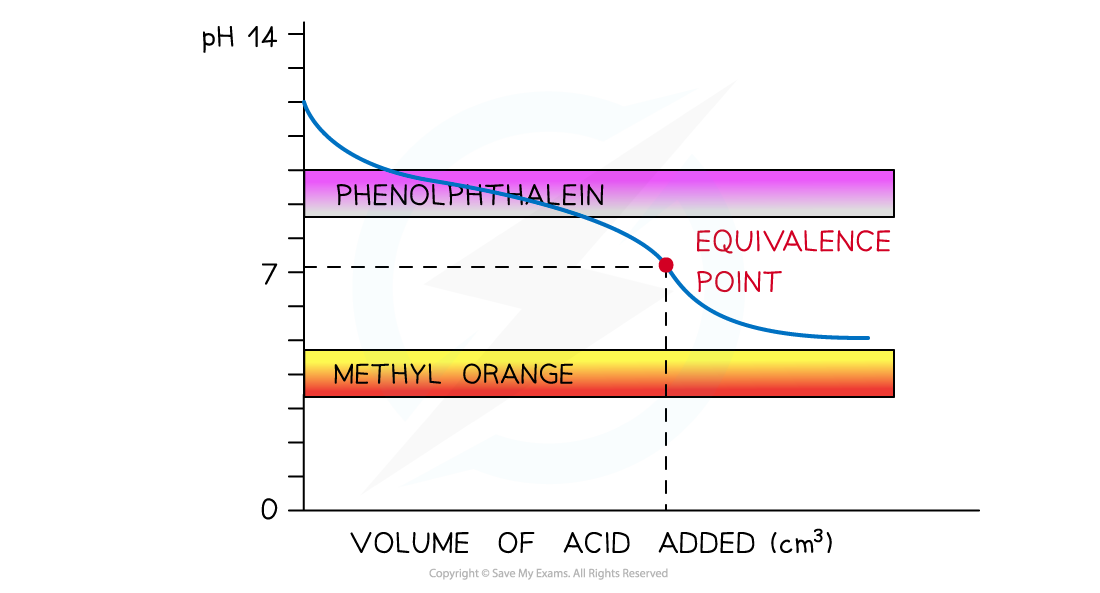
The diagram shows that nether indicators can be used to determine the endpoint of the titration of a weak acid and weak alkali
转载自savemyexams
以上就是关于【CIE A Level Chemistry复习笔记1.7.13 Indicators used in Titration】的解答,如需了解学校/赛事/课程动态,可至翰林教育官网获取更多信息。
往期文章阅读推荐:
翰林独家 | 经济学竞赛核心精讲,一册打通NEC/IEO/USAEBO!
2026 ALEVEL 夏考A率出炉!爱德思vs牛津AQA,哪些科目真的“好出分”?


翰林AMC8视频课重磅上线!

国际竞赛真题资源免费领取






