CIE A Level Biology复习笔记17.1.4 Variation: t-test Worked Example

Variation: t-test Worked Example
Worked Example
The ear length of two populations of rabbits was measured.Ear lengths of population A (mm):
62, 60, 59, 61, 60, 58, 59, 60, 57, 56, 59, 58, 60, 59, 57
Ear lengths of population B (mm):58, 59, 57, 59, 59, 57, 55, 60, 57, 58, 59, 58, 57, 58, 59
Use the t-test to determine whether there is a significant difference in ear length between the two populations.
Solution
-
- Null hypothesis: There is no significant difference between the ear lengths of the rabbits in populations A and B
- Sample sizes:
- Population A: n1 = 15
- Population B: n2 = 15
Step 1: Calculate the mean for each data set:
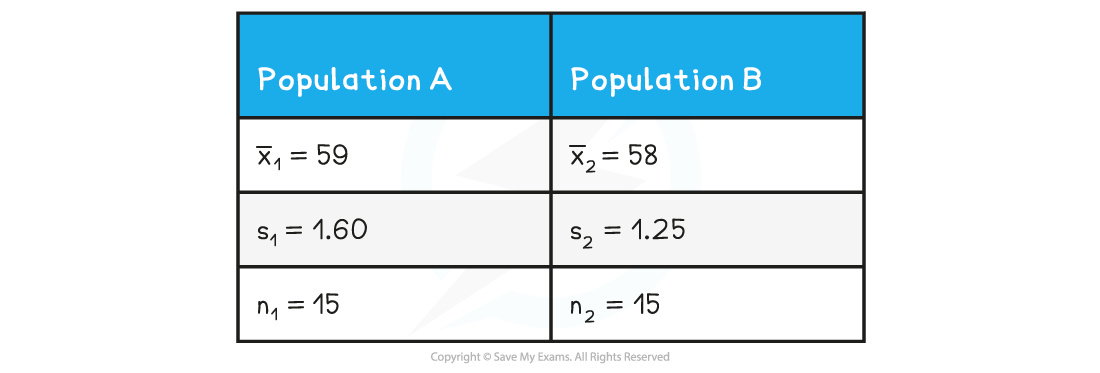
Mean for population A x̅1 = 885 / 15 = 59 mm
Mean for population B x̅2 = 870 / 15 = 58 mm
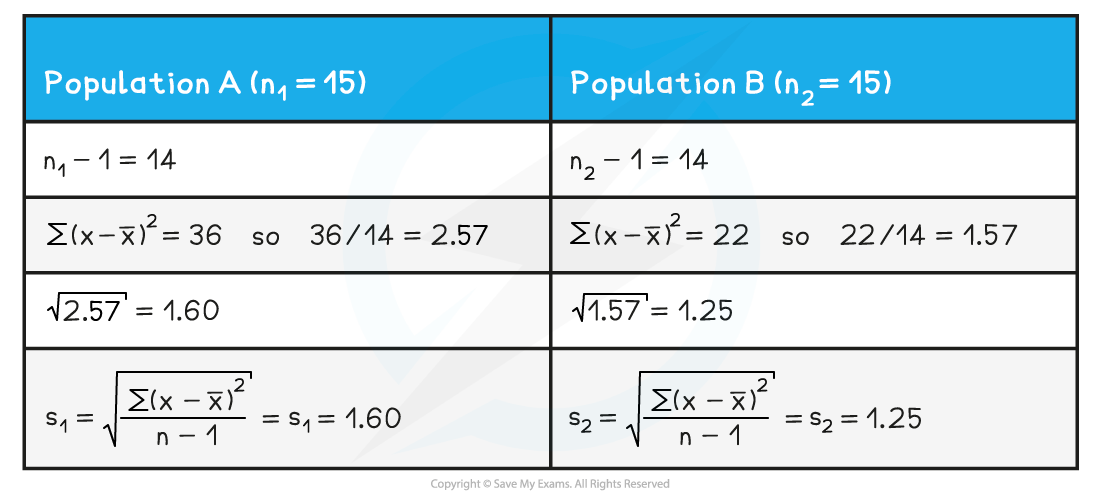
Step 2: Calculate the standard deviation (s) for each set of data
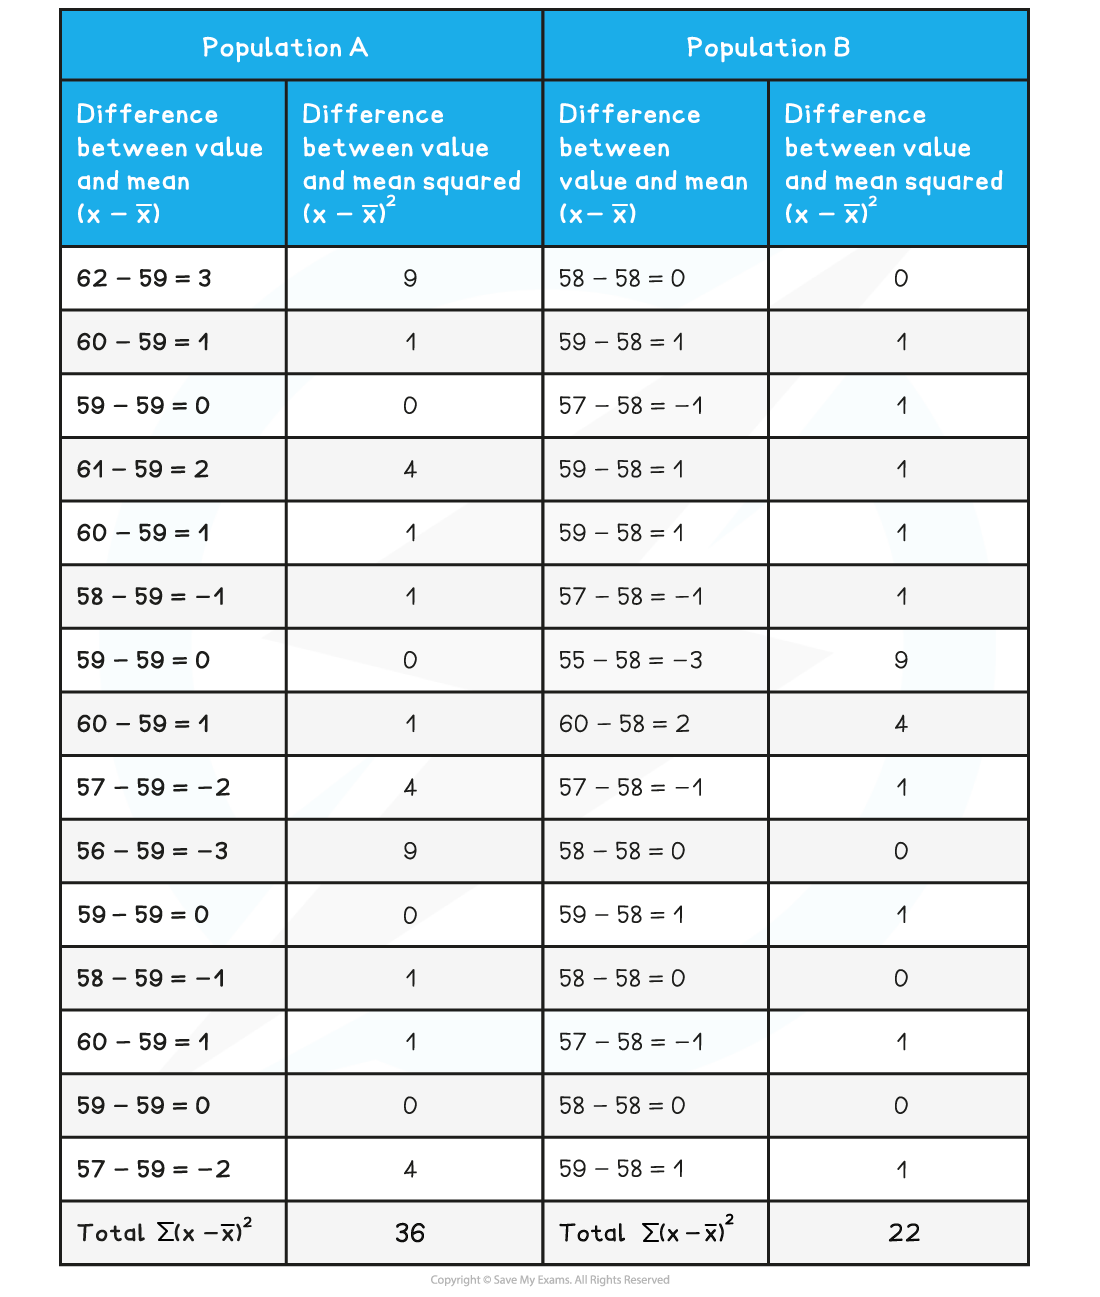
To find the standard deviations divide the sum of each square by n - 1 for each data set, and take the square root of each value
Step 3: Square the standard deviation and divide by n (the number of observations) in each sample, for both samples:
Step 4: Add the values from step 3 together and find the square root
Step 5: Divide the difference between the two means by the value from step 4

Step 6: Calculate the degrees of freedom (v) for all the data:
v = (n1 - 1) + (n2 - 1) = 14 + 14 = 28
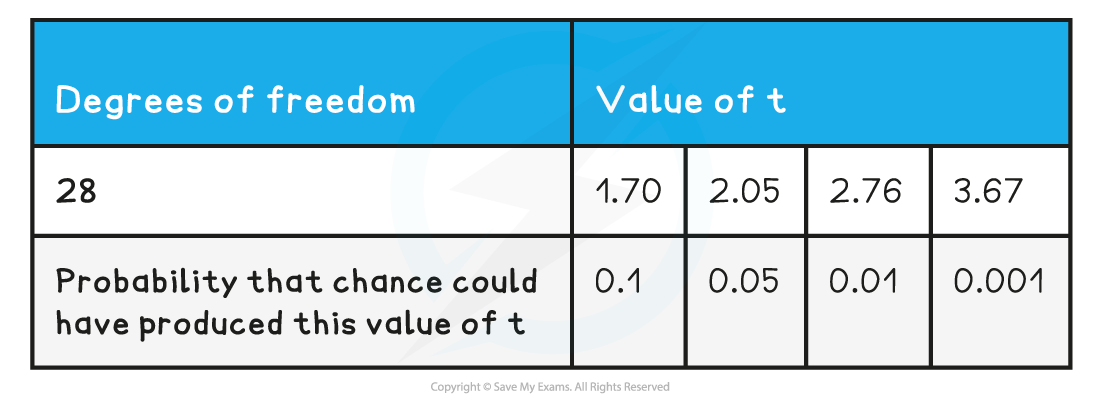
Step 7: Look at a table that relates t values to the probability that the differences between data sets is due to chance to find where the t value of 1.91 for 28 degrees of freedom (v) calculated lies
Step 8: Draw a conclusion about the statistical relevance of the data
A t value of 1.91 represents a probability between 0.05 and 0.1 which is greater than the critical value of 0.05.
This means the null hypothesis should be accepted, as there are no significant differences between the two sets of results (any differences between the means of the ear length of rabbits in the two populations are due to chance)
转载自savemyexams
以上就是关于【CIE A Level Biology复习笔记17.1.4 Variation: t-test Worked Example】的解答,如需了解学校/赛事/课程动态,可至翰林教育官网获取更多信息。
往期文章阅读推荐:
全网破防!ALevel CIE数学M1疑似错题?经济P2难度飙升?5月6日大考考情分析必看!
A-Level CIE就大规模泄题发布最严处罚!哪些考生必须重考?你的成绩怎么办?

翰林AMC8视频课重磅上线!

国际竞赛真题资源免费领取


