IB DP Chemistry: SL复习笔记6.1.7 Maxwell-Boltzmann Curves

Maxwell-Boltzmann Curves
Boltzmann distribution curve
- The Boltzmann distribution curve is a graph that shows the distribution of energies at a certain temperature
- In a sample of a substance, a few particles will have very low energy, a few particles will have very high energy, and many particles will have energy in between
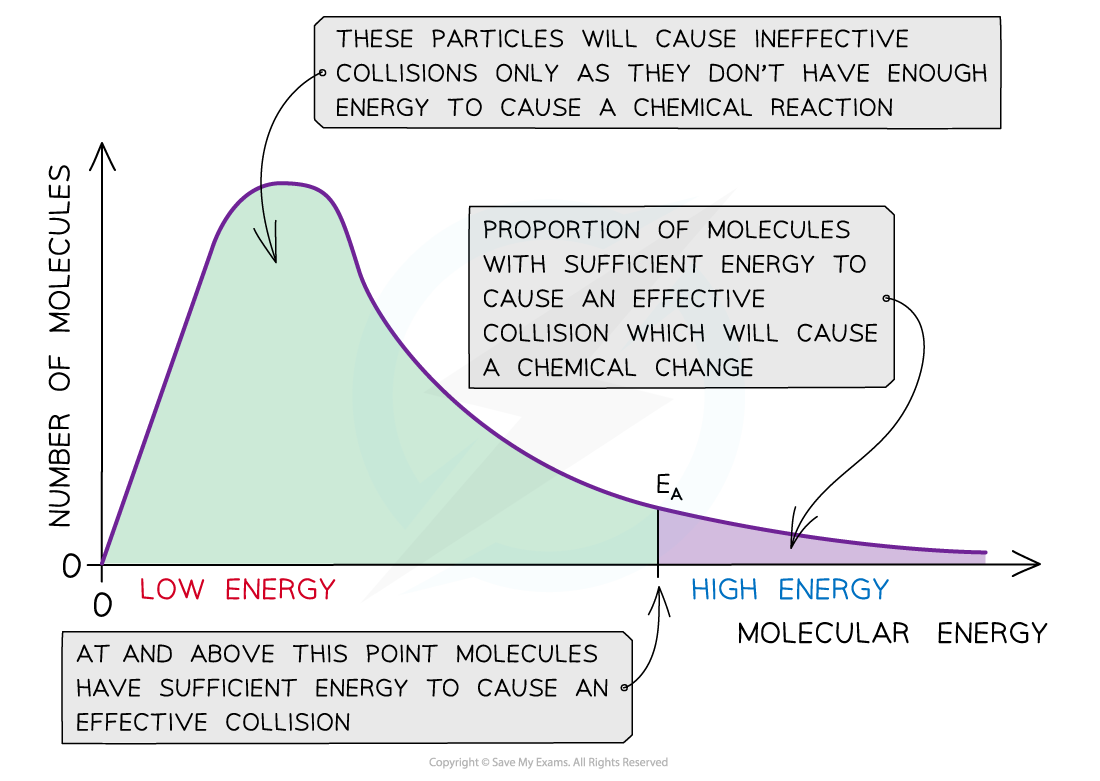
The Boltzmann distribution curve shows the distribution of the energies and the activation energy
- The graph shows that only a small proportion of molecules in the sample have enough energy for an effective or successful collision and for a chemical reaction to take place
Changes in temperature
- When the temperature of a reaction mixture is increased, the particles gain more kinetic energy
- This causes the particles to move around faster resulting in more frequent collisions
- Furthermore, the proportion of successful collisions increases, meaning a higher proportion of the particles possess the minimum amount of energy (activation energy) to cause a chemical reaction
- With higher temperatures, the Boltzmann distribution curve flattens and the peak shifts to the right
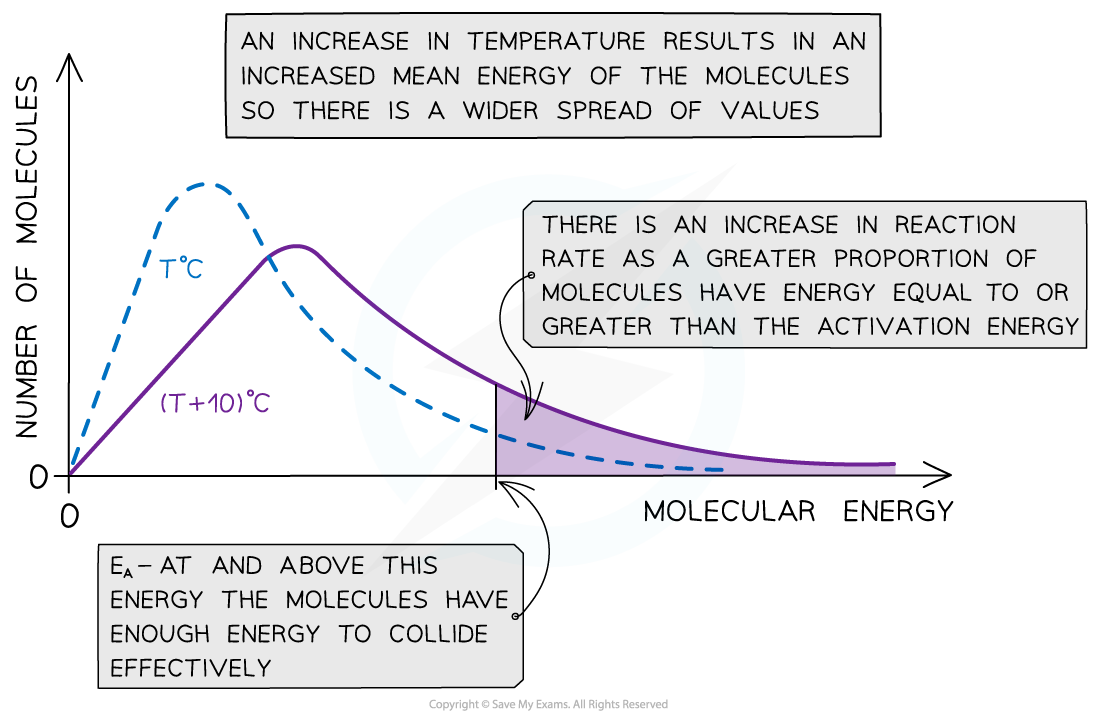
The Boltzmann distribution curve at T oC and when the temperature is increased by 10 oC
- Therefore, an increase in temperature causes an increased rate of reaction due to:
- There being more effective collisions as the particles have more kinetic energy, making them move around faster
- A greater proportion of the molecules having kinetic energy greater than the activation energy
Effect of a catalyst on the Maxwell-Boltzmann distribution curve
- A catalyst provides the reactants another pathway which has a lower activation energy
- By lowering Ea, a greater proportion of molecules in the reaction mixture have sufficient energy for a successful collision
- As a result of this, the rate of the catalysed reaction is increased compared to the uncatalyzed reaction
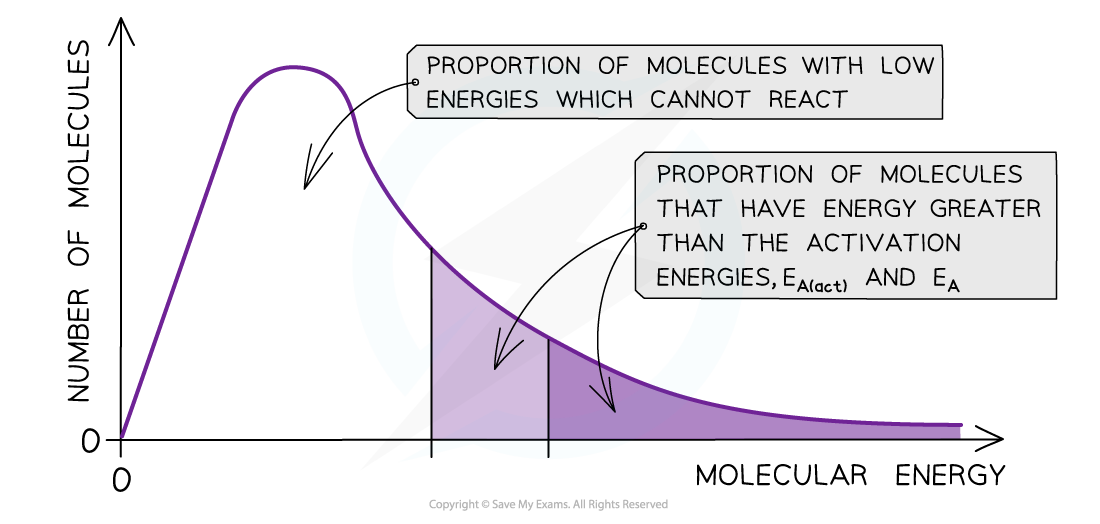
The diagram shows that the total shaded area (both dark and light shading) under the curve shows the number of particles with energy greater than the Ea when a catalyst is present. This area is much larger than the dark shaded area which shows the number of particles with energy greater than the Ea without a catalyst
Exam Tip
Make sure you know how to sketch and label the axes in Maxwell-Boltzmann distribution curves. The curve must start at the origin and it approaches, but never touches the x- axis
转载自savemyexams
以上就是关于【IB DP Chemistry: SL复习笔记6.1.7 Maxwell-Boltzmann Curves】的解答,如需了解学校/赛事/课程动态,可至翰林教育官网获取更多信息。
往期文章阅读推荐:
深耕九载!30+国际竞赛/课程讲义,硕博100%团队操刀,助力爬藤冲G5!

翰林AMC8视频课重磅上线!

国际竞赛真题资源免费领取


