IB DP Chemistry: HL复习笔记16.1.3 Graphical Representations

Graphical Representations of Reaction Order
Reaction Order Using Concentration-Time Graphs
- In a zero-order reaction, the concentration of the reactant is inversely proportional to time
- This means that the reactant concentration decreases as time increases
- The graph is a straight line going down as shown:
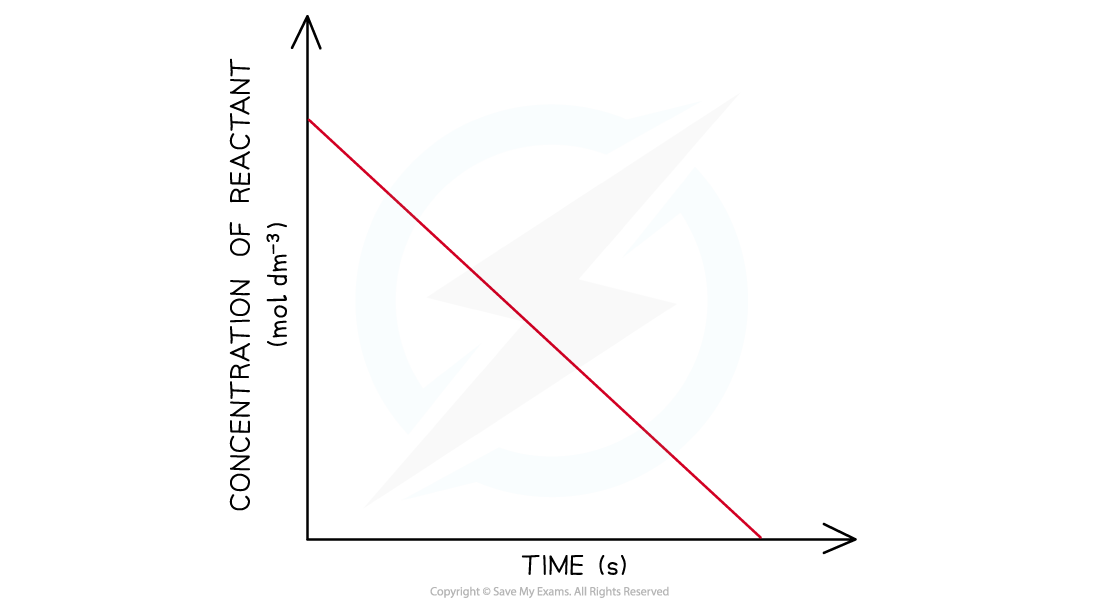
Concentration-time graph of a zero-order reaction
- The gradient of the line is the rate of reaction
- Calculating the gradient at different points on the graph, will give a constant value for the rate of reaction
- When the order with respect to a reactant is 0, a change in the concentration of the reactant has no effect on the rate of the reaction
- Therefore:
Rate = k
- This equation means that the gradient of the graph is the rate of reaction as well as the rate constant, k
- In a first-order reaction, the concentration of the reactant decreases with time
- The graph is a curve going downwards and eventually plateaus:
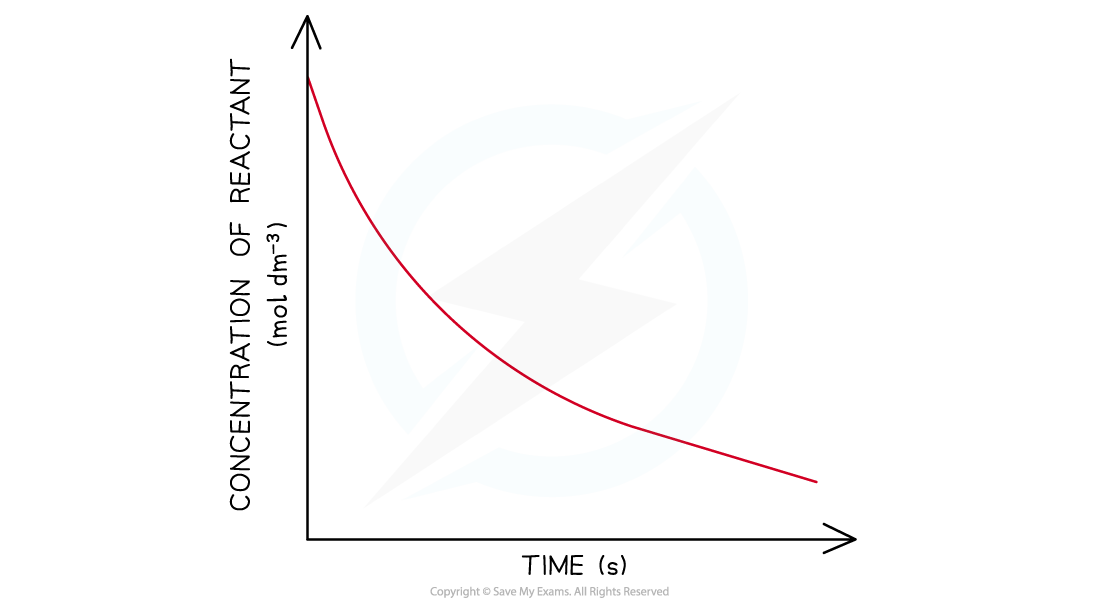
Concentration-time graph of a first-order reaction
- In a second-order reaction, the concentration of the reactant decreases more steeply with time
- The concentration of reactant decreases more with increasing time compared to a first-order reaction
- The graph is a steeper curve going downwards:
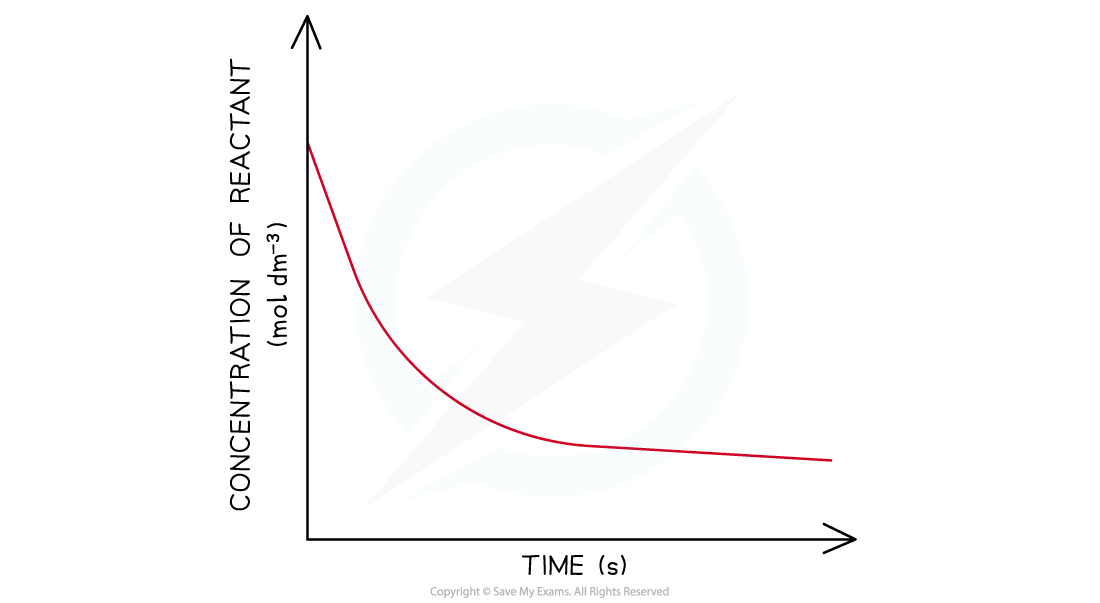
Concentration-time graph of a second-order reaction
Order of reaction from half-life
- The order of a reaction can also be deduced from its half-life (t1/2 )
- For a zero-order reaction the successive half-lives decrease with time
- This means that it would take less time for the concentration of reactant to halve as the reaction progresses
- The half-life of a first-order reaction remains constant throughout the reaction
- The amount of time required for the concentration of reactants to halve will be the same during the entire reaction
- For a second-order reaction, the half-life increases with time
- This means that as the reaction is taking place, it takes more time for the concentration of reactants to halve
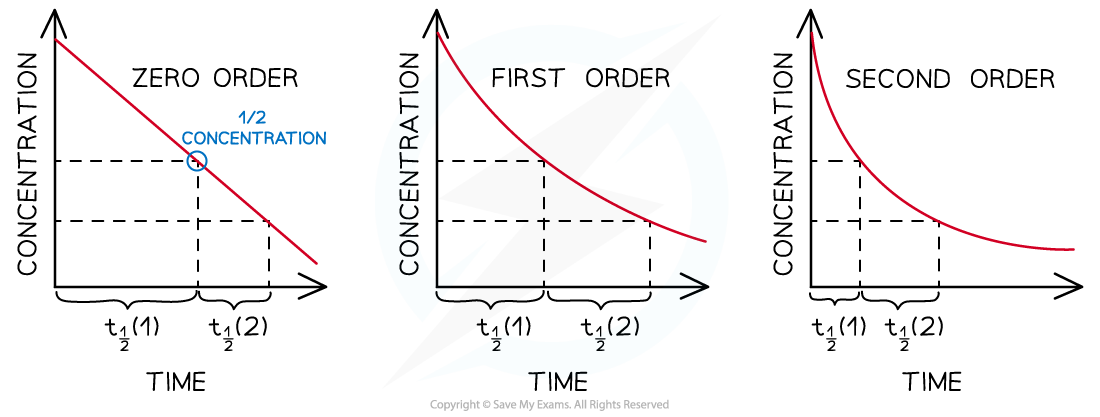
Half-lives of zero, first and second-order reactions
Exam Tip
Make sure that you know the correct shapes for the concentration-time graphs. It can be easy to confuse some concentration-time graphs with the following rate-concentration graphs, particularly;
- The straight line of a zero-order concentration-time graph with the straight line of a first-order rate-concentration graph.
- The curve of a first-order concentration-time graph with the curve of a second-order rate-concentration graph.
Reaction order using rate-concentration graphs
- In a zero-order reaction, the rate doesn’t depend on the concentration of the reactant
- The rate of the reaction therefore remains constant throughout the reaction
- The graph is a horizontal line
- The rate equation is rate = k
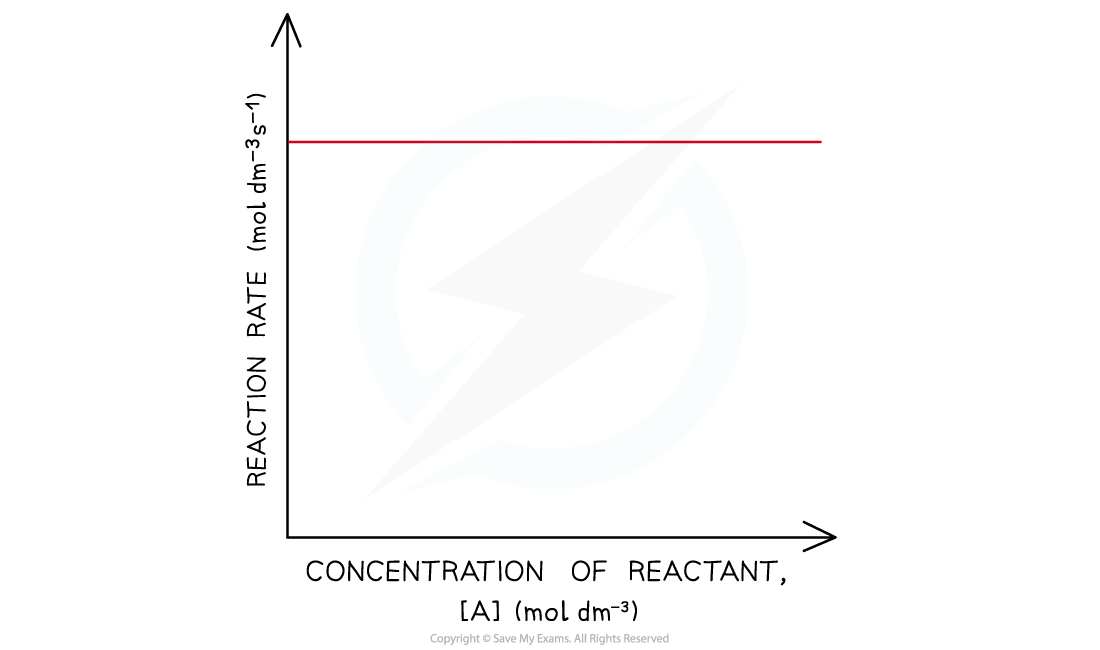
Rate-concentration graph of a zero-order reaction
- In a first-order reaction, the rate is directly proportional to the concentration of a reactant
- The rate of the reaction increases as the concentration of the reactant increases
- This means that the rate of the reaction decreases as the concentration of the reactant decreases when it gets used up during the reaction
- The graph is a straight line
- The rate equation is rate = k[A]

Rate-concentration graph of a first-order reaction
- In a second-order reaction, the rate is directly proportional to the square of concentration of a reactant
- The rate of the reaction increases more as the concentration of the reactant increases
- This means that the rate of the reaction decreases more as the concentration of the reactant decreases when it gets used up during the reaction
- The graph is a curved line
- The rate equation is rate = k[A]2

Rate-concentration graphs of a second-order reaction
Exam Tip
Careful - sometimes when asked to complete calculations for the rate constant, k, the exam question will give you a graph as well as tabulated data. Do not ignore the graph as this demonstrates the order of one of the reactants, while the tabulated data allows you to determine the order for the other reactants.
转载自savemyexams
以上就是关于【IB DP Chemistry: HL复习笔记16.1.3 Graphical Representations】的解答,如需了解学校/赛事/课程动态,可至翰林教育官网获取更多信息。
往期文章阅读推荐:
MIT官方发布【2026年夏季推荐阅读书单】!横跨科学/人文/经济...
IBO官宣!M26 IB放榜全球均分30.88!香港诞生66名状元,内地均分35.47全球领跑!


翰林AMC8视频课重磅上线!

国际竞赛真题资源免费领取


