IB DP Chemistry: HL复习笔记11.2.5 Drawing Graphs

Drawing Graphs
General guidance on drawing graphs
- Graphs need to have:
- Clear title
- Labelled axes
- Units on the axes
- Appropriate linear scales without any jumps
- This means the plotted graph must occupy at least half or more of the sheet or grid
- A rough rule of thumb is that if you can double the scale and still fit all the points on, then your scale is not appropriate
- Clearly shown data points
- The most common convention is to use small crosses to show the data points
Graph of concentration versus time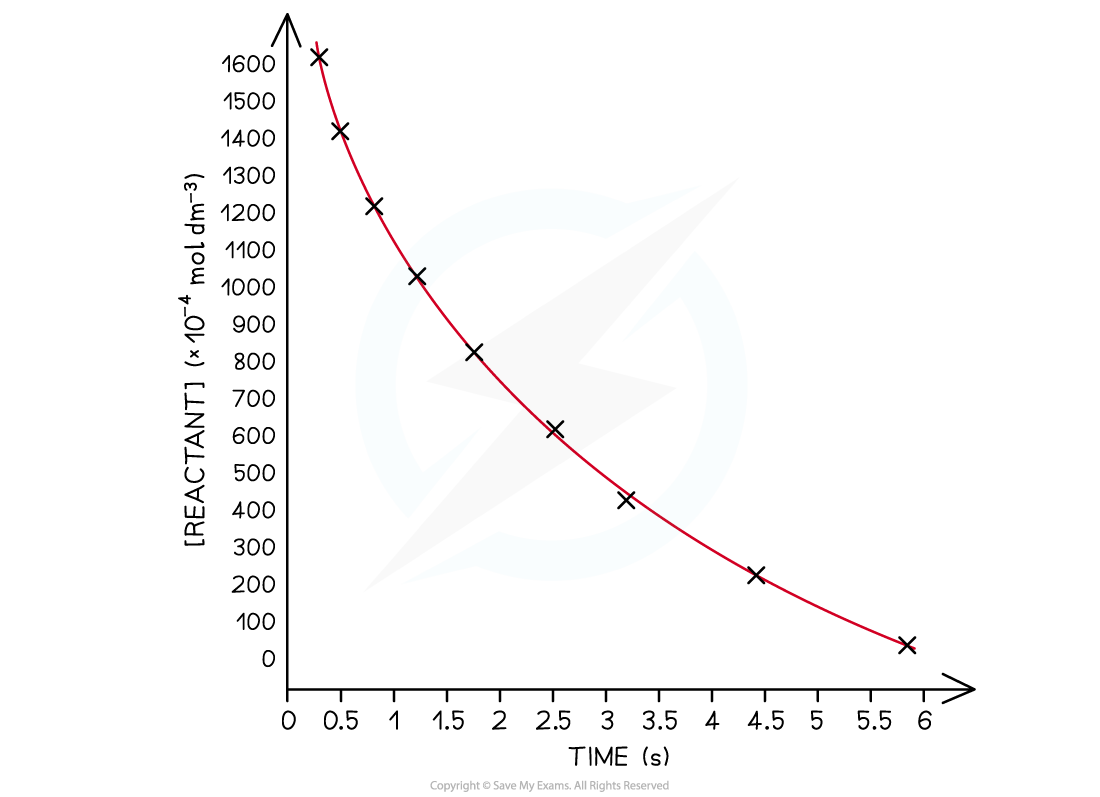
Graphs must shows appropriate scales, labelling and units. The independent variable usually goes on the x-axis and the dependent variable on the y-axis
- Remember the independent variable is the one you control or manipulate and the dependent variable is the one that changes as a result of your manipulation
- Always draw data points in pencil as it makes it easier to make corrections and adjustments
Best Fit Lines
- Students often confuse the term lines of best fit with straight lines
- Lines of best fit can be straight lines or curves (just like the example above) and:
- They show the trend of the data
- It does not have to go through all the points, but shows the general trend
- They must go through the majority of the points
- Where the data is scattered the points should be evenly distributed on either side of the best fit line
- They show the trend of the data
- Sometimes the best fit line has to be extended to find a value from a graph
- This is called extrapolation as this example shows from a temperature correction graph in a calorimetry investigation where the cooling section is extrapolated to find the maximum temperature rise:
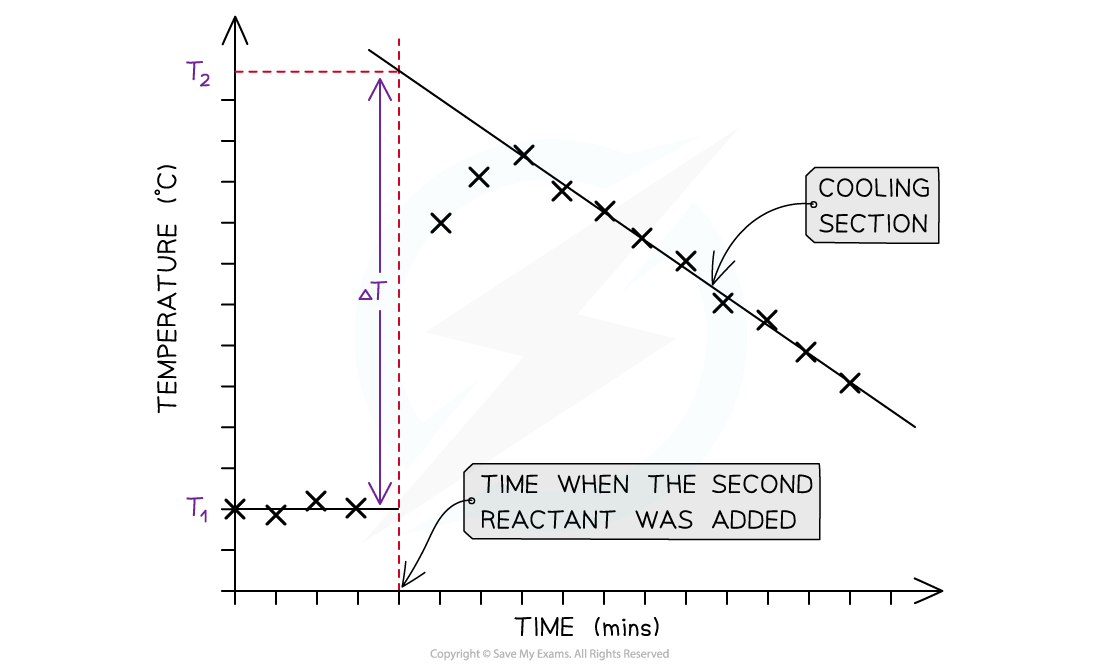
Extrapolation on a temperature correction graph
- Interpolation is the term used to describe the process of assuming a trend line applies between two points as this example below shows:
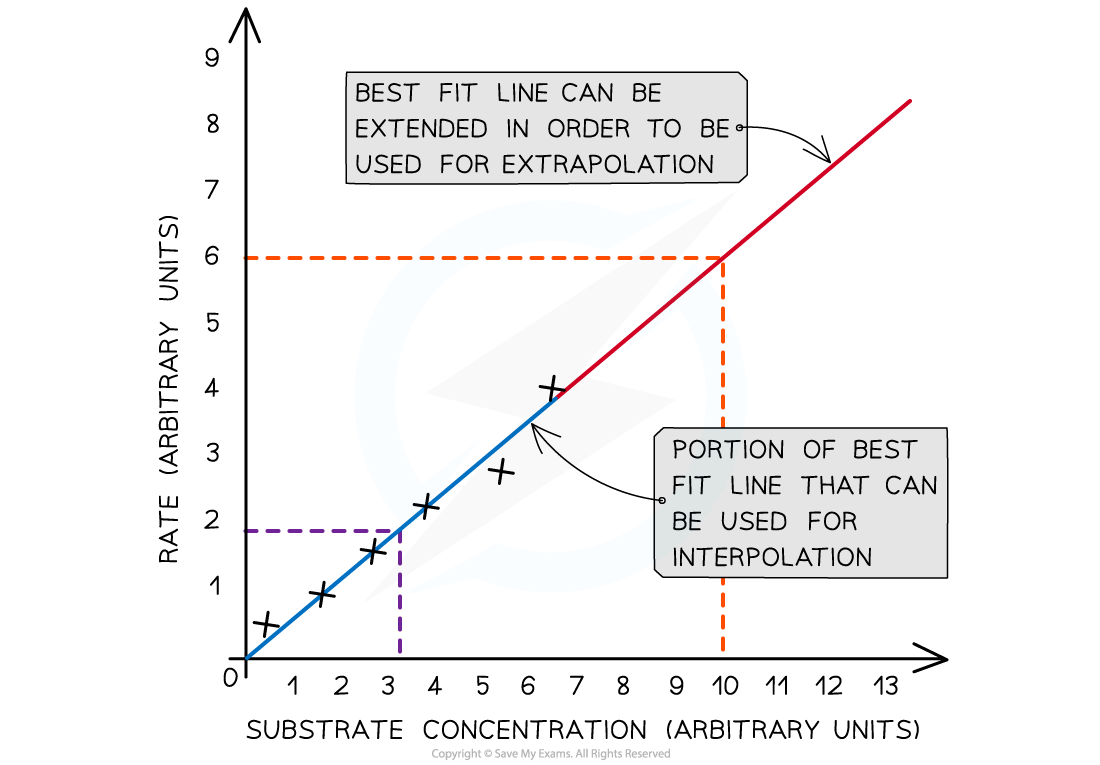
The difference between extrapolation and interpolation on a graph
Exam Tip
You will have to decide if the origin, point (0,0) should be included as a data pointIf it does, it will be a good place to anchor the graph as it will be the most accurate data point
转载自savemyexams
以上就是关于【IB DP Chemistry: HL复习笔记11.2.5 Drawing Graphs】的解答,如需了解学校/赛事/课程动态,可至翰林教育官网获取更多信息。
往期文章阅读推荐:
翰林独家 | 经济学竞赛核心精讲,一册打通NEC/IEO/USAEBO!
2026 AMC10/12美国数学竞赛新赛季!【翰林教育 × 清华大学出版社】独家教材全面发售!


翰林AMC8视频课重磅上线!

国际竞赛真题资源免费领取






