IB DP Maths: AI SL复习笔记4.1.3 Frequency Tables

Ungrouped Data
How are frequency tables used for ungrouped data?
- Frequency tables can be used for ungrouped data when you have lots of the same values within a data set
- They can be used to collect and present data easily
- If the value 4 has a frequency of 3 this means that there are three 4’s in the data set
How are measures of central tendency calculated from frequency tables with ungrouped data?
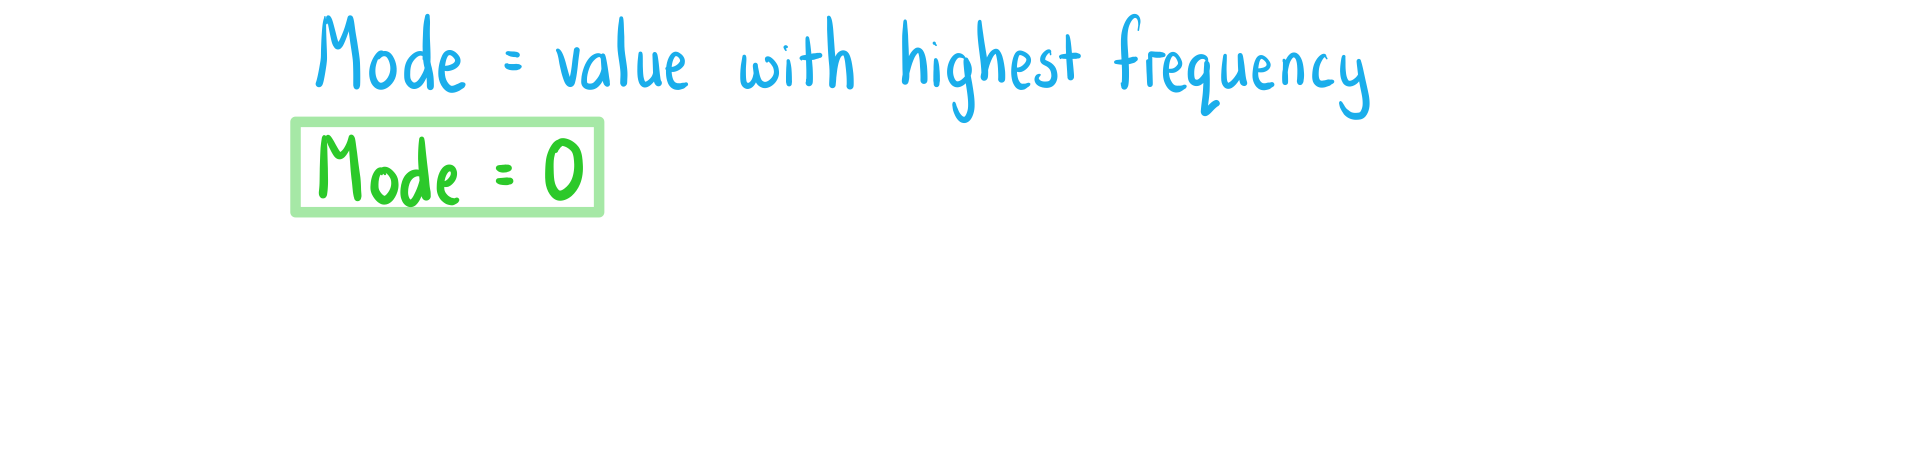
- The mode is the value that has the highest frequency
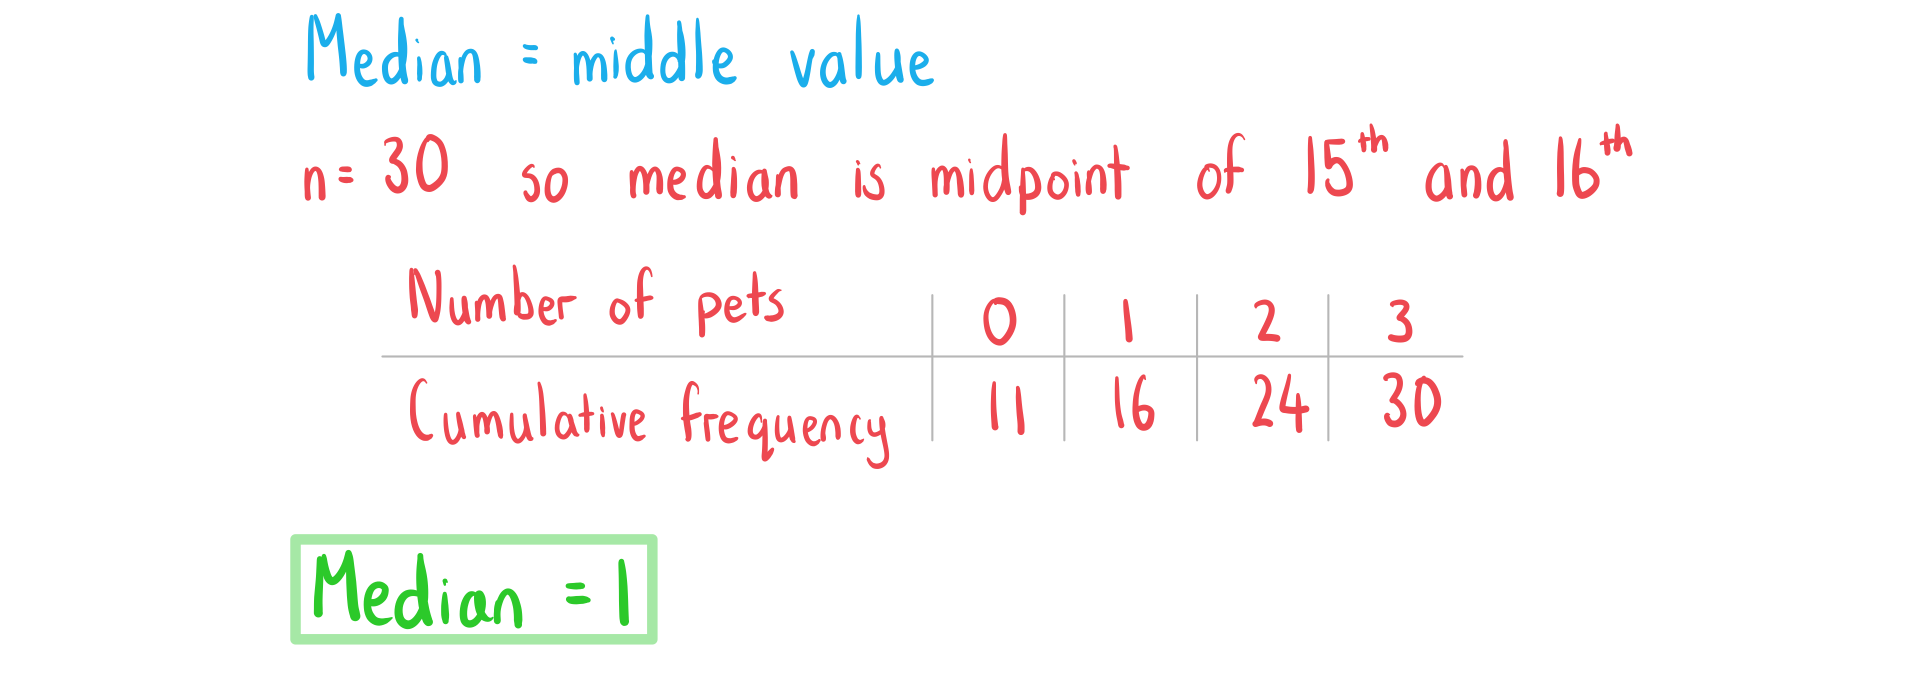
- The median is the middle value
- Use cumulative frequencies (running totals) to find the median
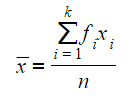
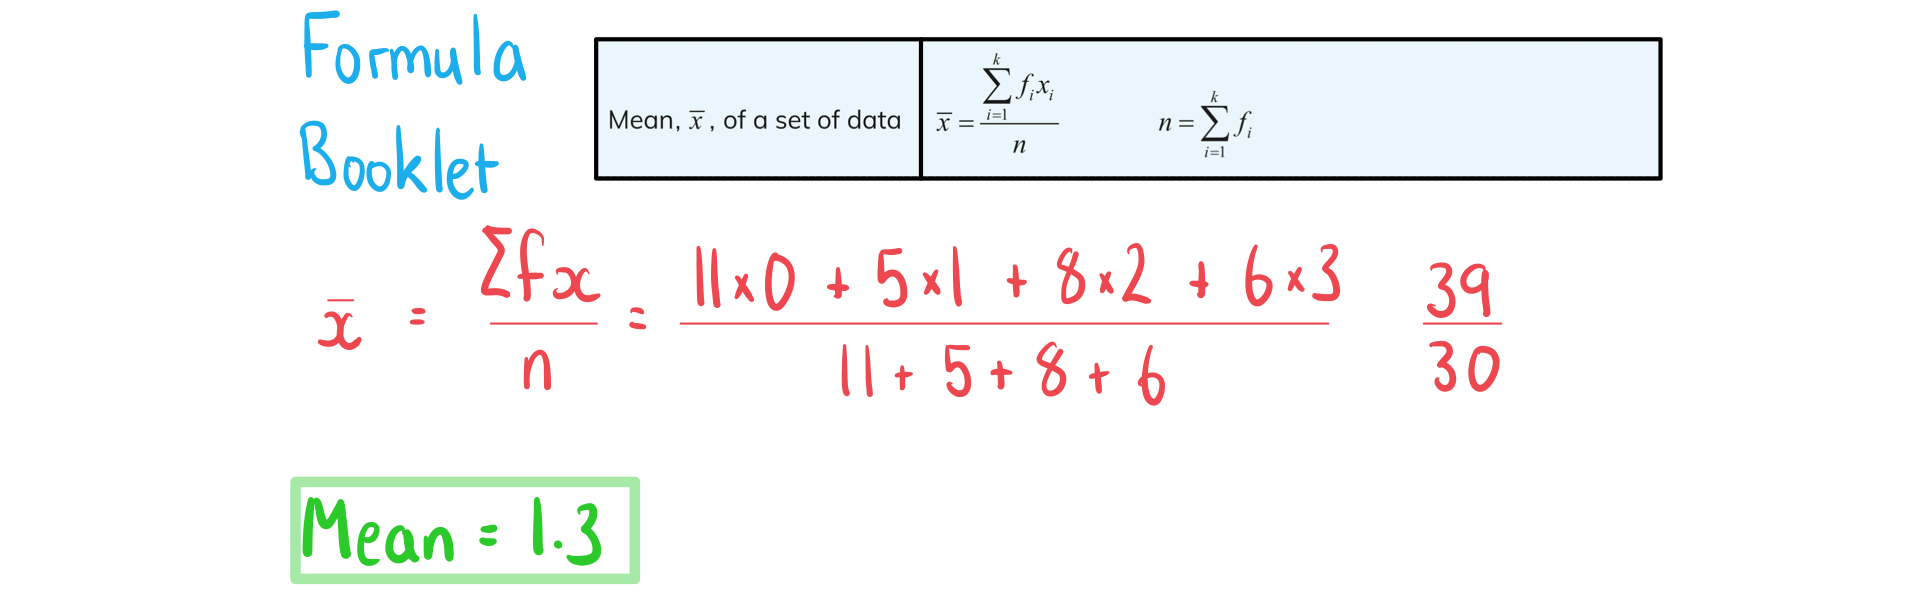
- The mean can be calculated by
- Multiplying each value xi by its frequency fi
- Summing to get Σfixi
- Dividing by the total frequency n = Σfi
- This is given in the formula booklet
-
 Your GDC can calculate these statistical measures if you input the values and their frequencies using the statistics mode
How are measures of dispersion calculated from frequency tables with ungrouped data?
- The range is the largest value of the data minus the smallest value of the data
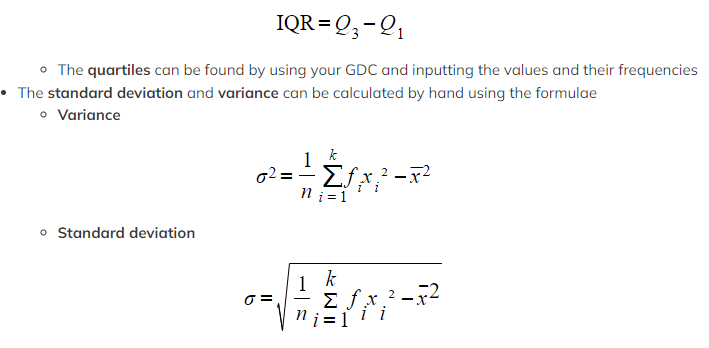
- The interquartile range is calculated by
-
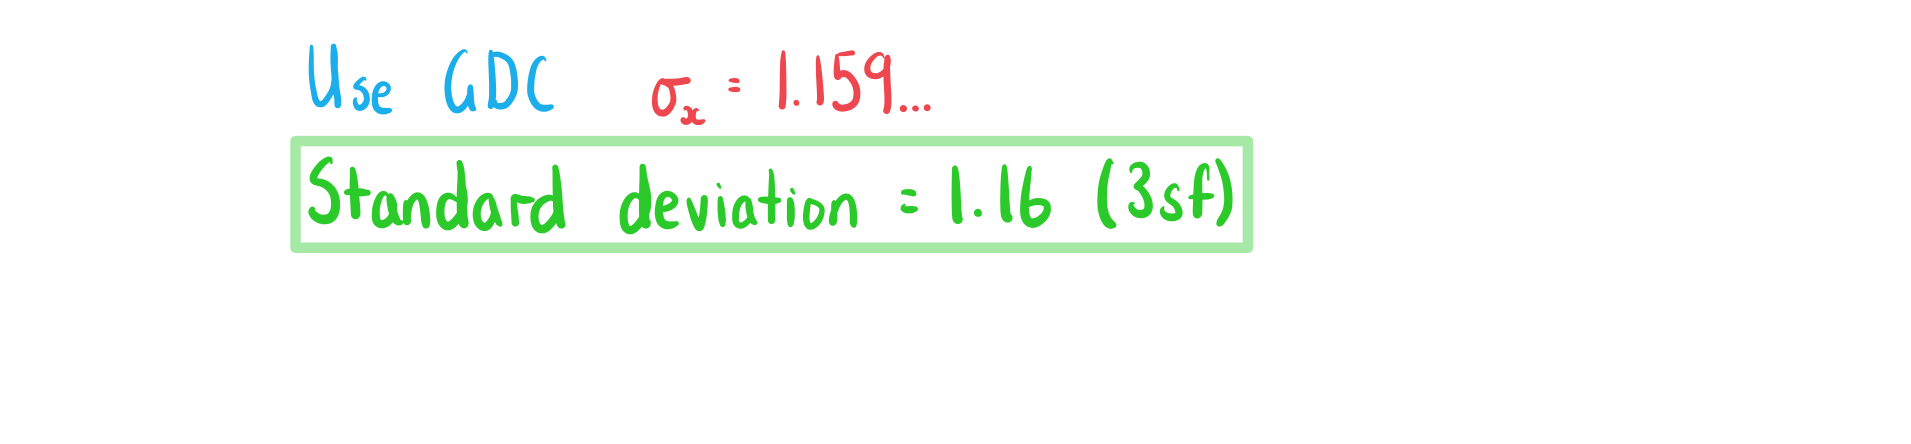
- You do not need to learn these formulae as you will be expected to use your GDC to find the standard deviation and variance
- You may want to see these formulae to deepen your understanding
- You do not need to learn these formulae as you will be expected to use your GDC to find the standard deviation and variance
Exam Tip
- Always check whether your answers make sense when using your GDC
- The value for a measure of central tendency should be within the range of data
Worked Example
The frequency table below gives information number of pets owned by 30 students in a class.
| Number of pets | 0 | 1 | 2 | 3 |
| Frequency | 11 | 5 | 8 | 6 |
Find
a)the mode.
b)the median.
c)the mean.
d)the standard deviation.
Grouped Data
How are frequency tables used for grouped data?
- Frequency tables can be used for grouped data when you have lots of the same values within the same interval
- Class intervals will be written using inequalities and without gaps
-
 You do not know the exact data values when you are given grouped data
How are measures of central tendency calculated from frequency tables with grouped data?
- The modal class is the class that has the highest frequency
- This is for equal class intervals only
- The median is the middle value
- The exact value can not be calculated but it can be estimated by using a cumulative frequency graph
- The exact mean can not be calculated as you do not have the raw data
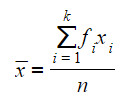
- The mean can be estimated by
- Identifying the mid-interval value (midpoint) xi for each class
- Multiplying each value by the class frequency fi
- Summing to get Σfixi
- Dividing by the total frequency n = Σfi
- This is given in the formula booklet
-
 Your GDC can estimate the mean if you input the mid-interval values and the class frequencies using the statistics mode
How are measures of dispersion calculated from frequency tables with grouped data?
- The exact range can not be calculated as the largest and smallest values are unknown
- The interquartile range can be estimated by
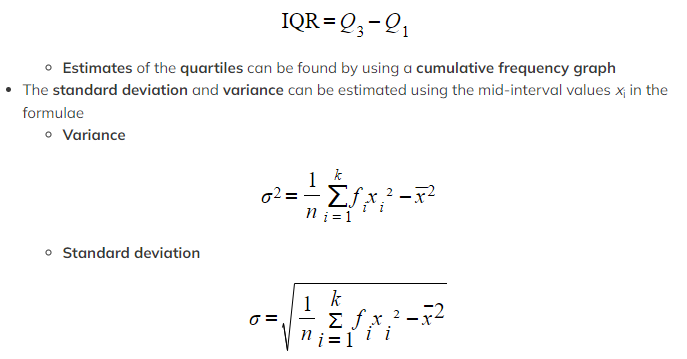
- You do not need to learn these formulae as you will be expected to use your GDC to estimate the standard deviation and variance using the mid-interval values
- You may want to see these formulae to deepen your understanding
Exam Tip
 Worked Example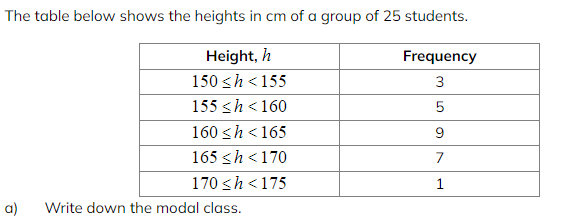
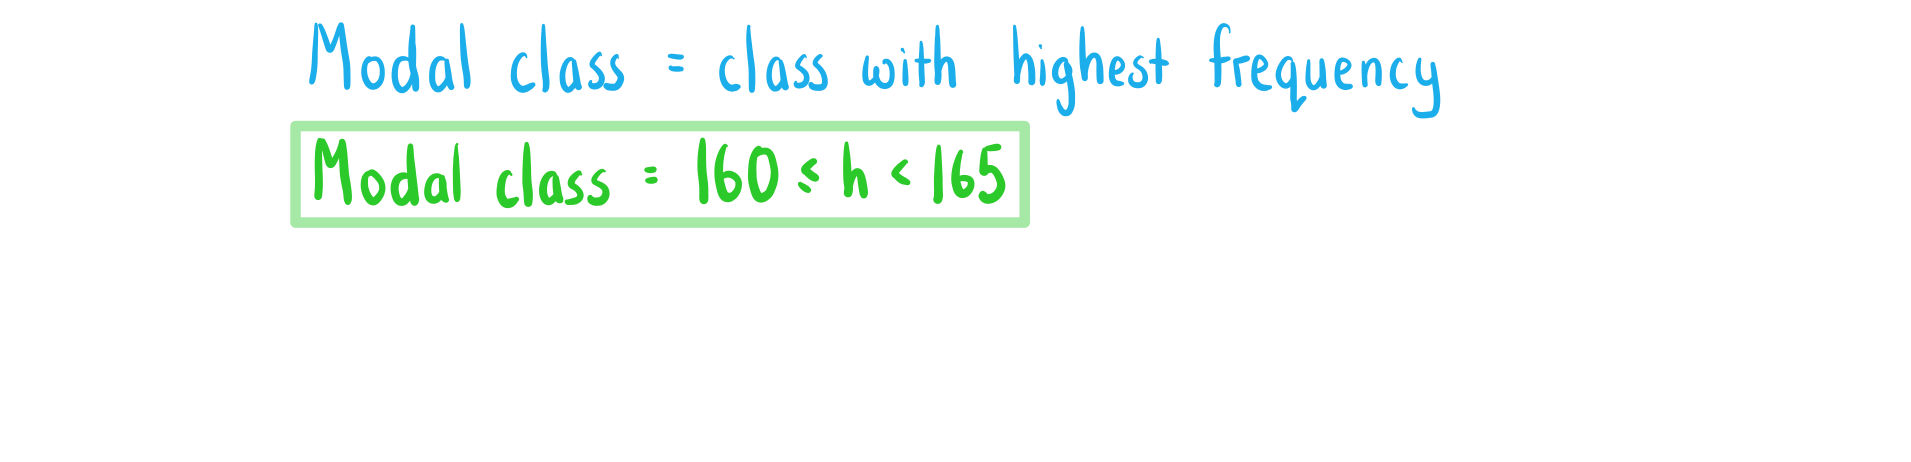
b)Write down the mid-interval value of the modal class.
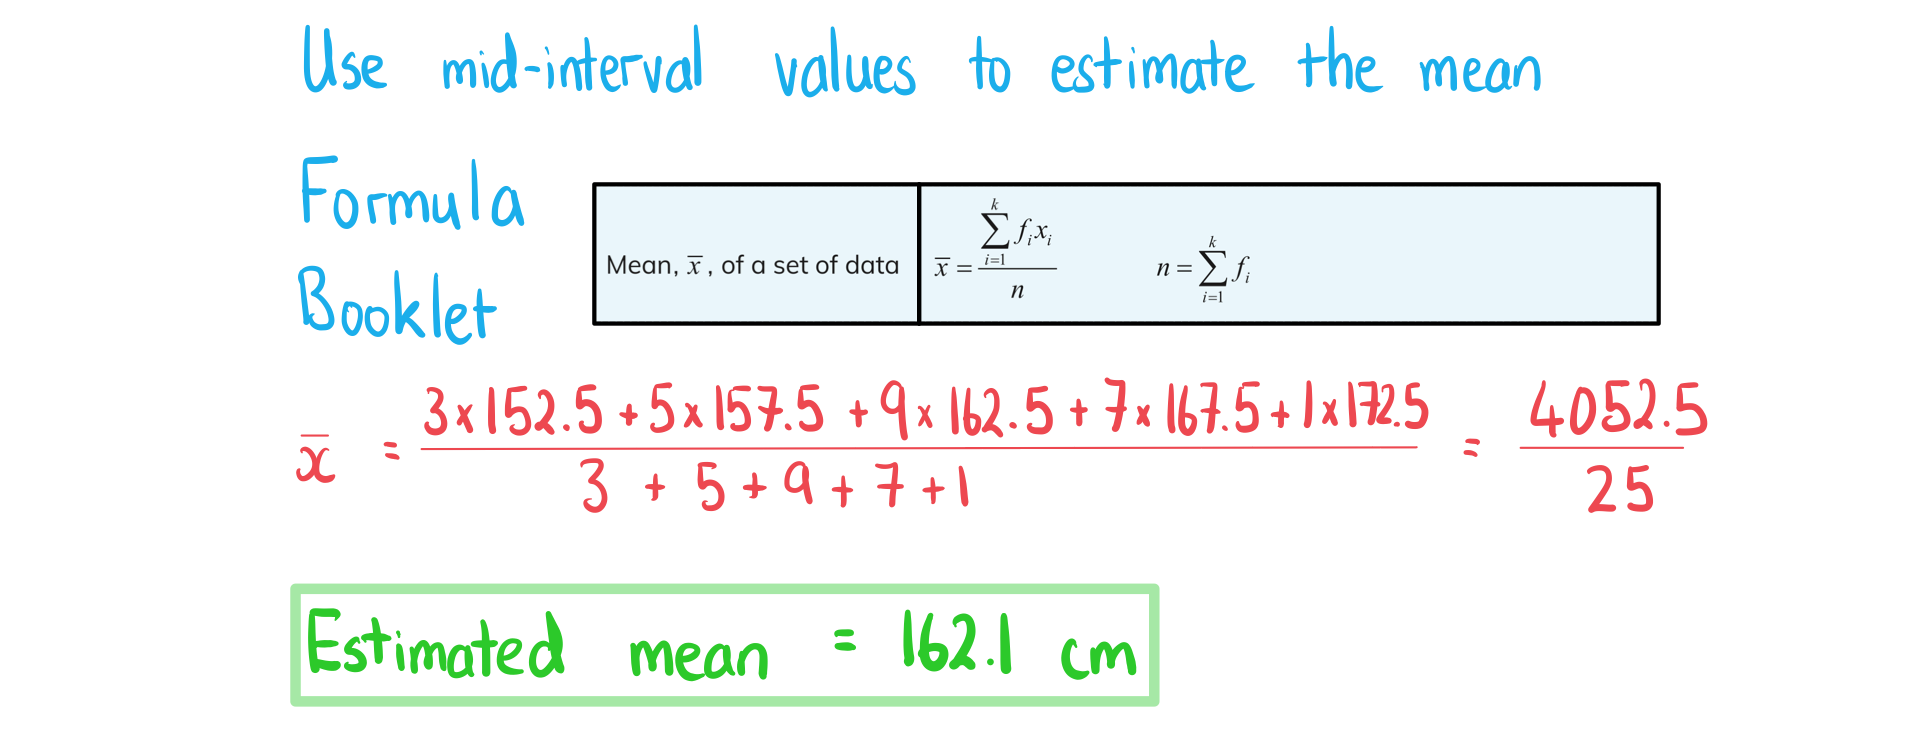
c)Calculate an estimate for the mean height.
转载自savemyexams
以上就是关于【IB DP Maths: AI SL复习笔记4.1.3 Frequency Tables】的解答,如需了解学校/赛事/课程动态,可至翰林教育官网获取更多信息。
往期文章阅读推荐:
翰林独家 | 经济学竞赛核心精讲,一册打通NEC/IEO/USAEBO!
2026 AMC10/12美国数学竞赛新赛季!【翰林教育 × 清华大学出版社】独家教材全面发售!


翰林AMC8视频课重磅上线!

国际竞赛真题资源免费领取






