IB DP Maths: AA HL复习笔记4.2.1 Bivariate Data

Scatter Diagrams
What does bivariate data mean?
- Bivariate data is data which is collected on two variables and looks at how one of the factors affects the other
- Each data value from one variable will be paired with a data value from the other variable
- The two variables are often related, but do not have to be
What is a scatter diagram?
- A scatter diagram is a way of graphing bivariate data
- One variable will be on the x-axis and the other will be on the y-axis
- The variable that can be controlled in the data collection is known as the independent or explanatory variable and is plotted on the x-axis
- The variable that is measured or discovered in the data collection is known as the dependent or response variable and is plotted on the y-axis
- Scatter diagrams can contain outliers that do not follow the trend of the data
Exam Tip
- If you use scatter diagrams in your Internal Assessment then be aware that finding outliers for bivariate data is different to finding outliers for univariate data
- (x, y) could be an outlier for the bivariate data even if x and y are not outliers for their separate univariate data
Correlation
What is correlation?
- Correlation is how the two variables change in relation to each other
- Correlation could be the result of a causal relationship but this is not always the case
- Linear correlation is when the changes are proportional to each other
- Perfect linear correlation means that the bivariate data will all lie on a straight line on a scatter diagram
- When describing correlation mention
- The type of the correlation
- Positive correlation is when an increase in one variable results in the other variable increasing
- Negative correlation is when an increase in one variable results in the other variable decreasing
- No linear correlation is when the data points don’t appear to follow a trend
- The strength of the correlation
- Strong linear correlation is when the data points lie close to a straight line
- Weak linear correlation is when the data points are not close to a straight line
- The type of the correlation
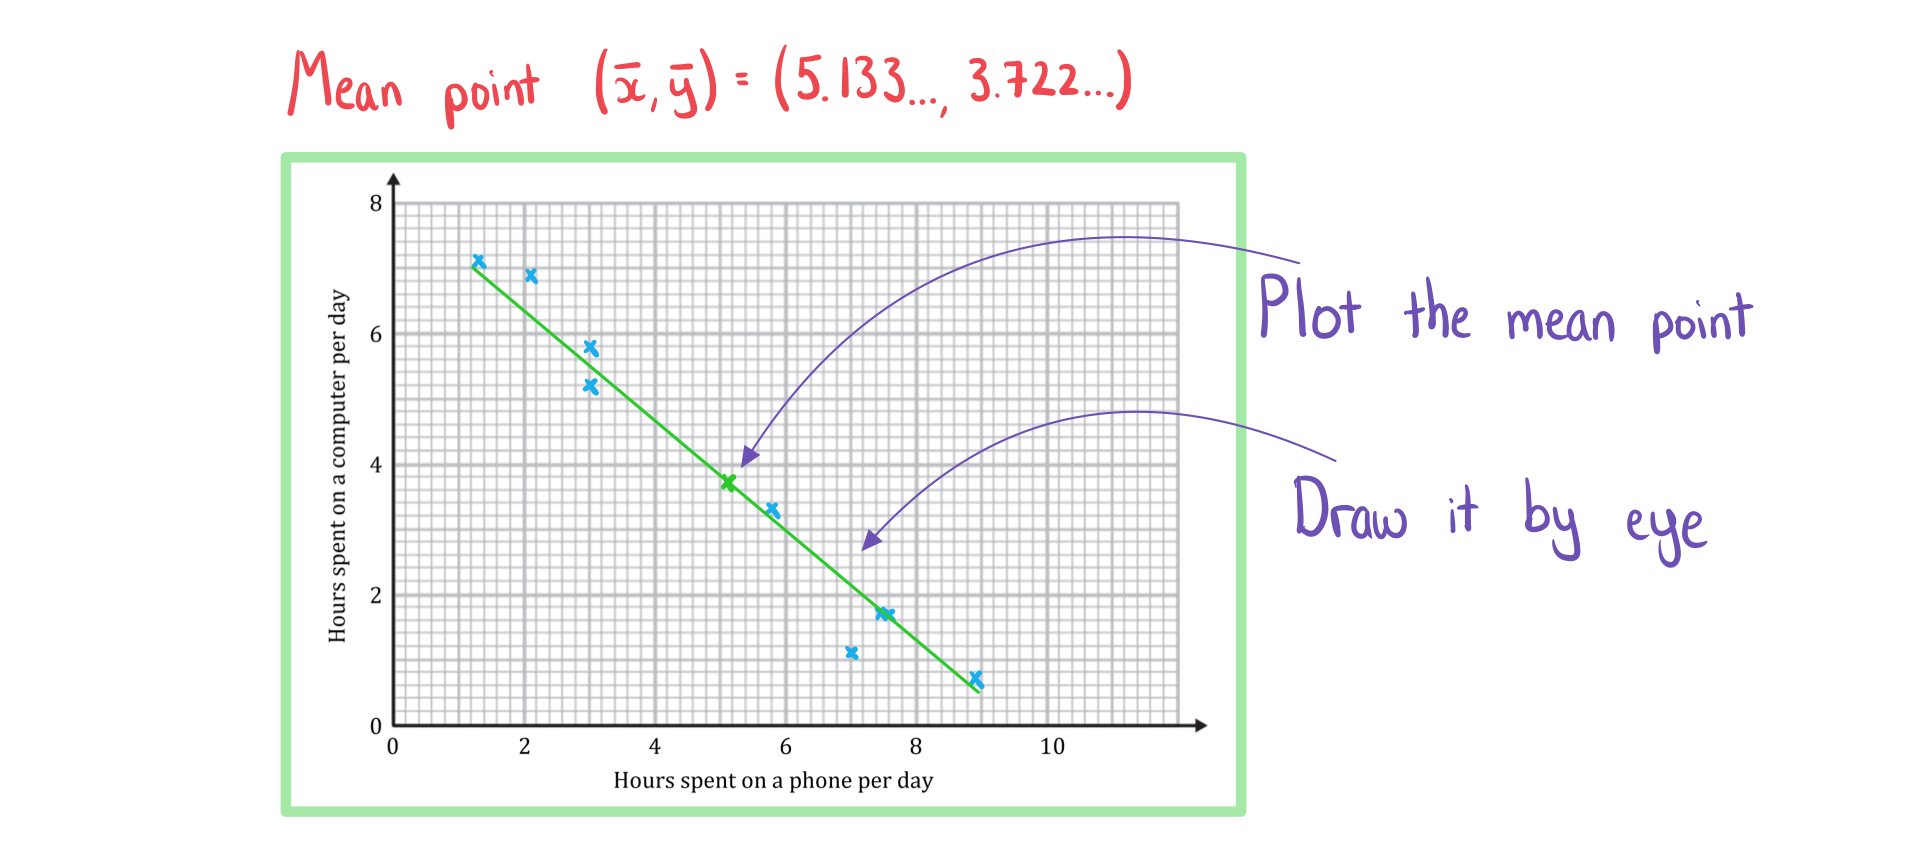
- If there is strong linear correlation you can draw a line of best fit (by eye)
- The line of best fit will pass through the mean point
<!--MathML:
(x¯" alt="left parenthesis x with bar on top comma space y with bar on top right parenthesis" data-mathml="<math xmlns="http://www.w3.org/1998/Math/MathML"><semantics><mrow><mo>(</mo><mover><mi>x</mi><mo>¯</mo></mover><mo>,</mo><mo> </mo><mover><mi>y</mi><mo>¯</mo></mover><mo>)</mo></mrow><annotation encoding="application/vnd.wiris.mtweb-params+json">{"language":"en","fontFamily":"Times New Roman","fontSize":"18"}</annotation></semantics></math>" /> - If you are asked to draw a line of best fit
- Plot the mean point
- Draw a line going through it that follows the trend of the data
- The line of best fit will pass through the mean point
What is the difference between correlation and causation?
- It is important to be aware that just because correlation exists, it does not mean that the change in one of the variables is causing the change in the other variable
- Correlation does not imply causation!
- If a change in one variable causes a change in the other then the two variables are said to have a causal relationship
- Observing correlation between two variables does not always mean that there is a causal relationship
- There could be underlying factors which is causing the correlation
- Look at the two variables in question and consider the context of the question to decide if there could be a causal relationship
- If the two variables are temperature and number of ice creams sold at a park then it is likely to be a causal relationship
- Correlation may exist between global temperatures and the number of monkeys kept as pets in the UK but they are unlikely to have a causal relationship
- Observing correlation between two variables does not always mean that there is a causal relationship
Worked Example
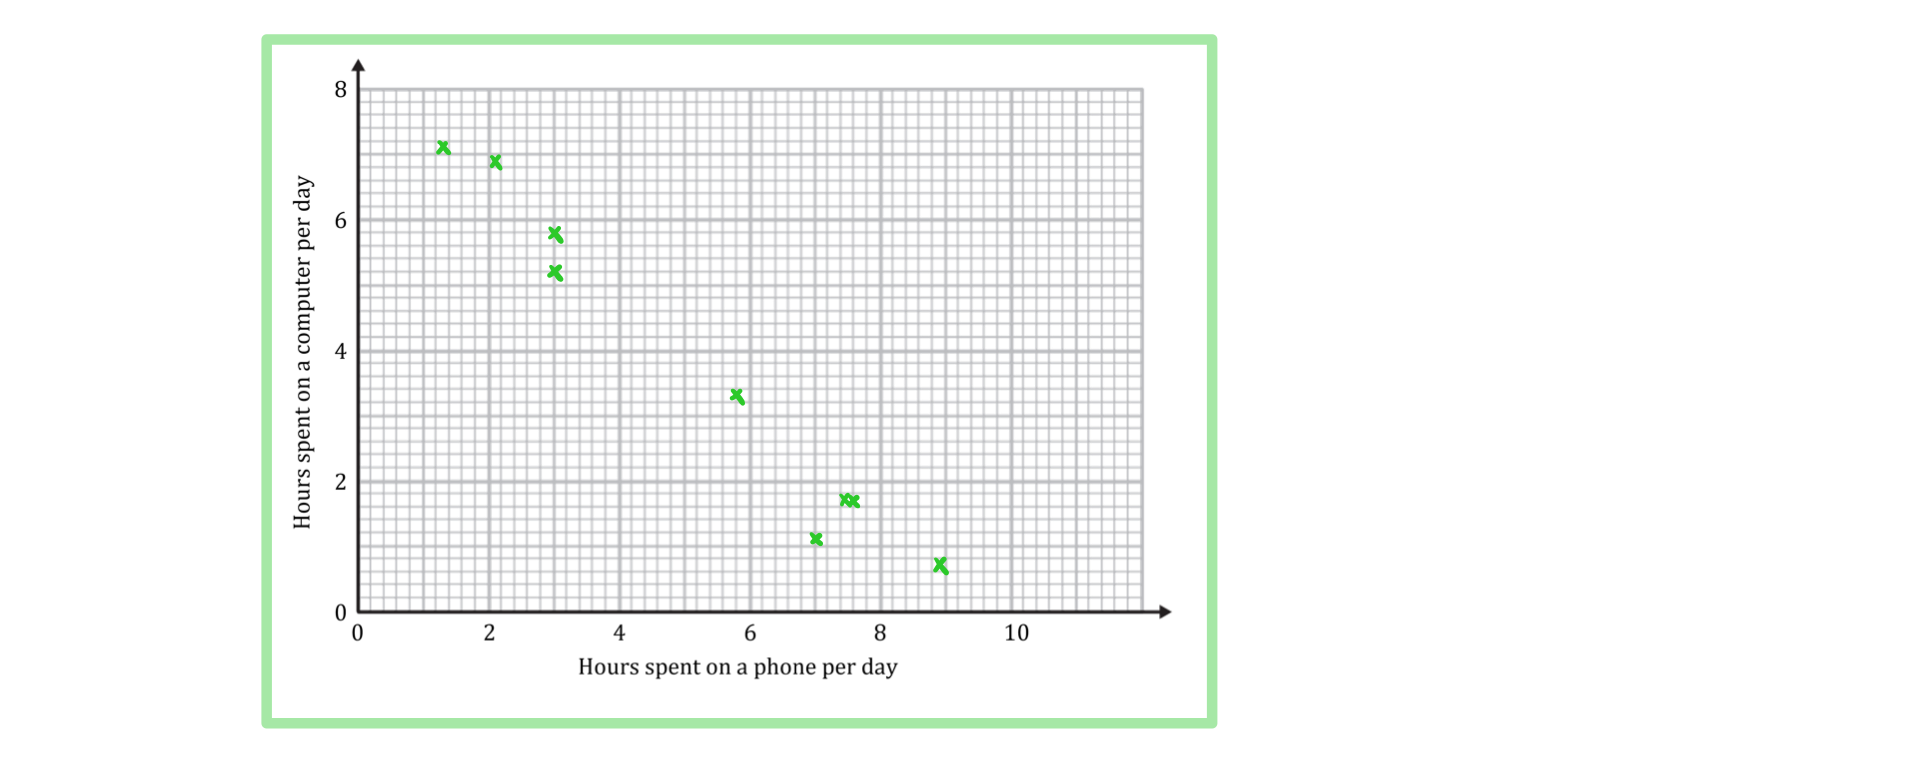
A teacher is interested in the relationship between the number of hours her students spend on a phone per day and the number of hours they spend on a computer. She takes a sample of nine students and records the results in the table below.
| Hours spent on a phone per day | 7.6 | 7.0 | 8.9 | 3.0 | 3.0 | 7.5 | 2.1 | 1.3 | 5.8 |
| Hours spent on a computer per day | 1.7 | 1.1 | 0.7 | 5.8 | 5.2 | 1.7 | 6.9 | 7.1 | 3.3 |
a) Draw a scatter diagram for the data.
b) Describe the correlation.

c) Draw a line of best fit.
转载自savemyexams
以上就是关于【IB DP Maths: AA HL复习笔记4.2.1 Bivariate Data】的解答,如需了解学校/赛事/课程动态,可至翰林教育官网获取更多信息。
往期文章阅读推荐:
翰林独家 | 经济学竞赛核心精讲,一册打通NEC/IEO/USAEBO!
2026 AMC10/12美国数学竞赛新赛季!【翰林教育 × 清华大学出版社】独家教材全面发售!


翰林AMC8视频课重磅上线!

国际竞赛真题资源免费领取






