Edexcel IGCSE Chemistry 复习笔记 1.1.5 Practical: Investigate the Solubility of a Solid in Water at a Specific Temperature

Edexcel IGCSE Chemistry 复习笔记 1.1.5 Practical: Investigate the Solubility of a Solid in Water at a Specific Temperature
Practical: Investigate the Solubility of a Solid in Water at a Specific Temperature
Aim:
To measure the solubility of a salt at different temperatures
Method:
- Prepare a two beakers, one as a hot water bath and one as an ice bath
- Using a small measuring cylinder, measure out 4 cm3 of distilled water into a boiling tube.
- On a balance weigh out 2.6 g of ammonium chloride and add it to the boiling tube
- Place the boiling tube into the hot water bath and stir until the solid dissolves
- Transfer the boiling tube to the ice bath and allow it to cool while stirring
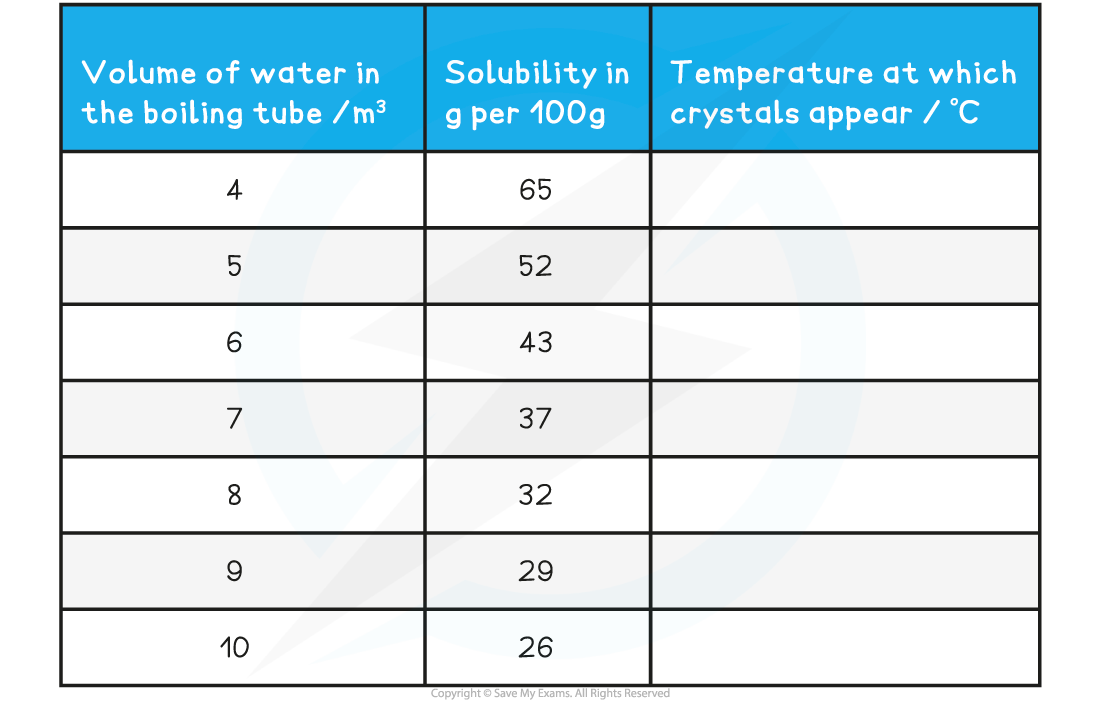
- Note the temperature at which crystals first appear and record it in a table of results
- Add 1 cm3 of distilled water then warm the solution again to dissolve the crystals
- Repeat the cooling process again noting the temperature at which crystals first appear.
- Continue the steps until a total of 10 cm3 of water has been added
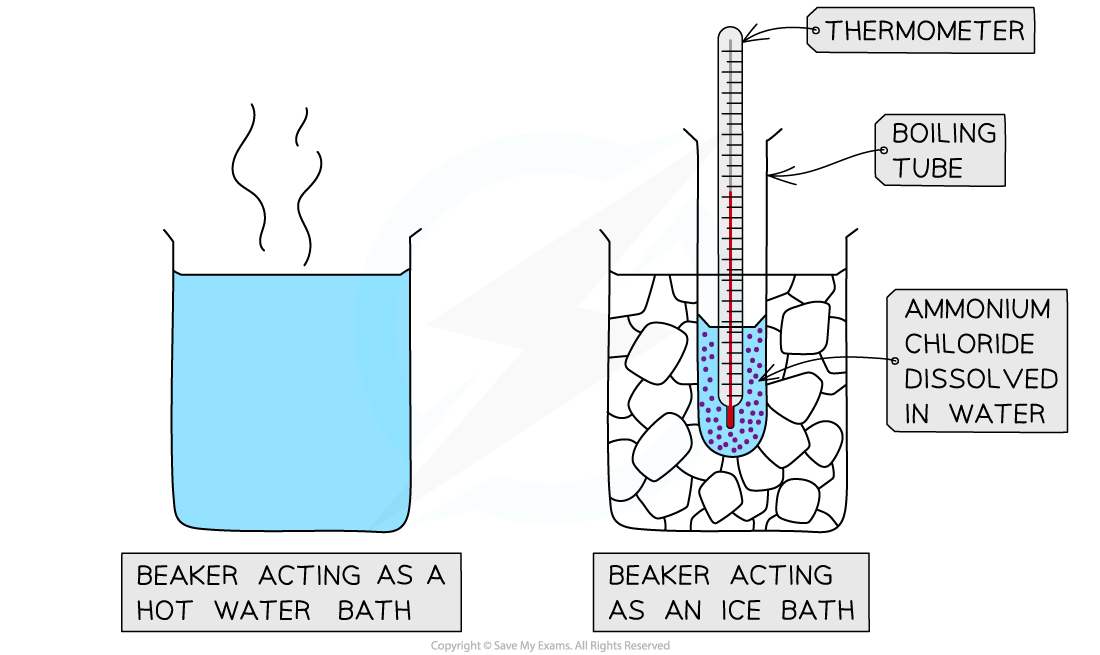
Apparatus for investigating the solubility of a salt with temperature
Results:
Table of Results for Recording Solubility
Graph:
Use the results to plot a solubility curve for ammonium chloride at different temperatures. Solubility is on the y-axis and temperature is on the x-axisConclusion:The shape of the graph will allow to state how the solubility varies with temperature
转载自savemyexam
以上就是关于【Edexcel IGCSE Chemistry 复习笔记 1.1.5 Practical: Investigate the Solubility of a Solid in Water at a Specific Temperature】的解答,如需了解学校/赛事/课程动态,可至翰林教育官网获取更多信息。
往期文章阅读推荐:
翰林独家 | 经济学竞赛核心精讲,一册打通NEC/IEO/USAEBO!
IGCSE全A*,A-Level阶段却崩了?别忽视IGCSE选课的重要性!


翰林AMC8视频课重磅上线!

国际竞赛真题资源免费领取






