AQA A Level Physics复习笔记7.2.3 Graphical Representation of Gravitational Potential

Graphical Representation of Gravitational Potential
- Gravitational field strength, gand the gravitational potential,V can be graphically represented against the distance from the centre of a planet, r
- g, V and r are related by the equation:

- Where:
- g = gravitational field strength (N kg-1)
- ΔV = change in gravitational potential (J kg-1)
- Δr = distance from the centre of a point mass (m)
- The graph of V against r for a planet is:
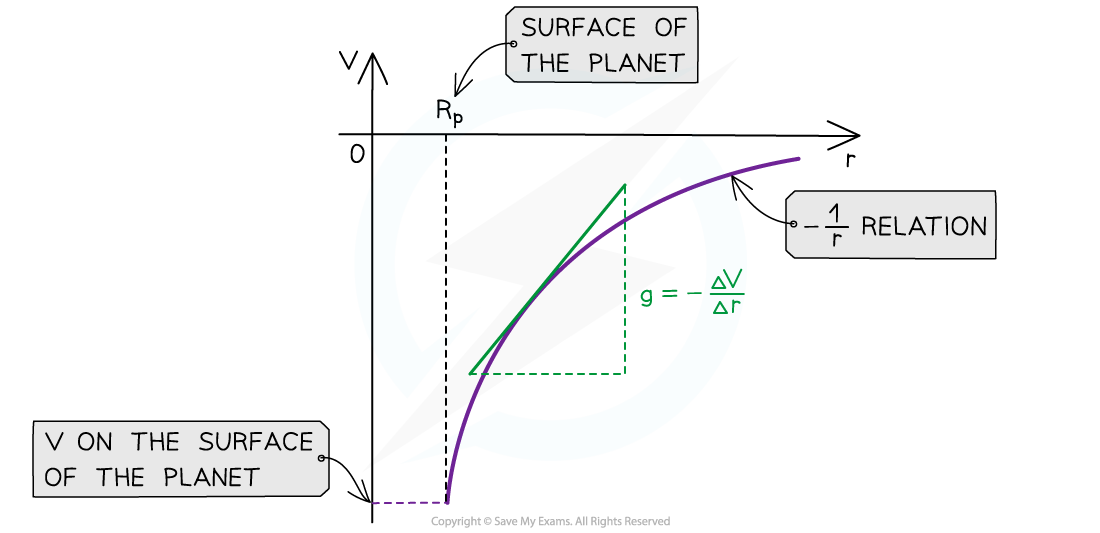
The gravitational potential and distance graphs follows a -1/r relation
- The key features of this graph are:
- The values for V are all negative
- As r increases, V against r follows a -1/r relation
- The gradient of the graph at any particular point is the value of g at that point
- The graph has a shallow increase as r increases
- To calculate g, draw a tangent to the graph at that point and calculate the gradient of the tangent
- This is a graphical representation of the equation:
 where G and M are constant
- The graph of g against r for a planet is:
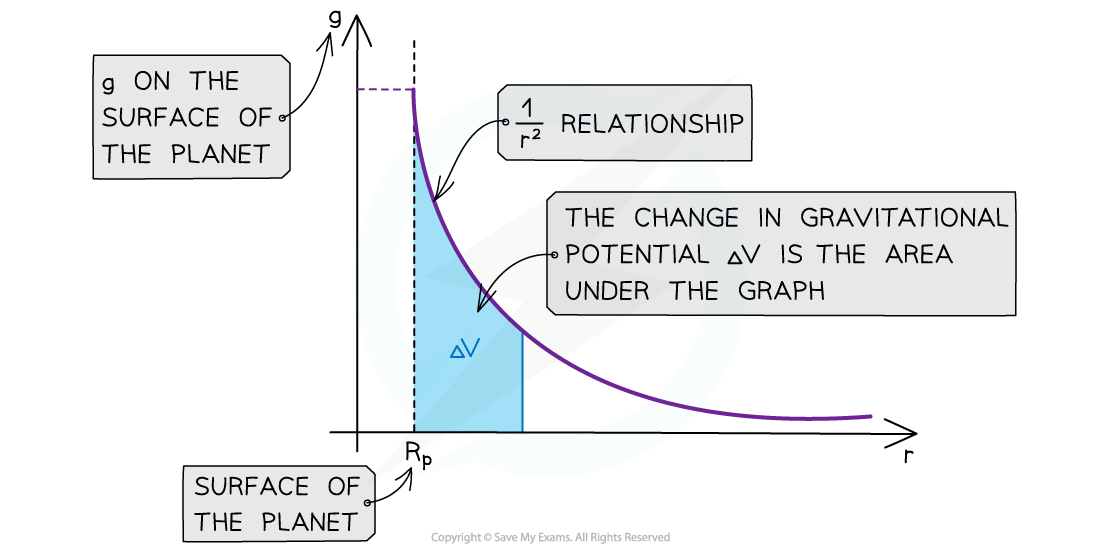
The gravitational field strength and distance graph follows a 1/r2 relation
- The key features of this graph are:
- The values for g are all positive
- As r increases, g against r follows a 1/r2 relation (inverse square law)
- The area under this graph is the change in gravitational potential ΔV
- The graph has a steep decline as r increases
- The area under the graph can be estimated by counting squares, if it is plotted on squared paper, or by splitting it into trapeziums and summing the area of each trapezium
- The inverse square law relation means that as the distance r doubles, g decreases by a factor of 4
- This is a graphical representation of the equation:
 where G and M are constant
Worked Example
Sketch a graph on the axes below to indicate how the gravitational potential varies with distance along a line outwards from the surface of planet A which is 80 times the mass of planet B.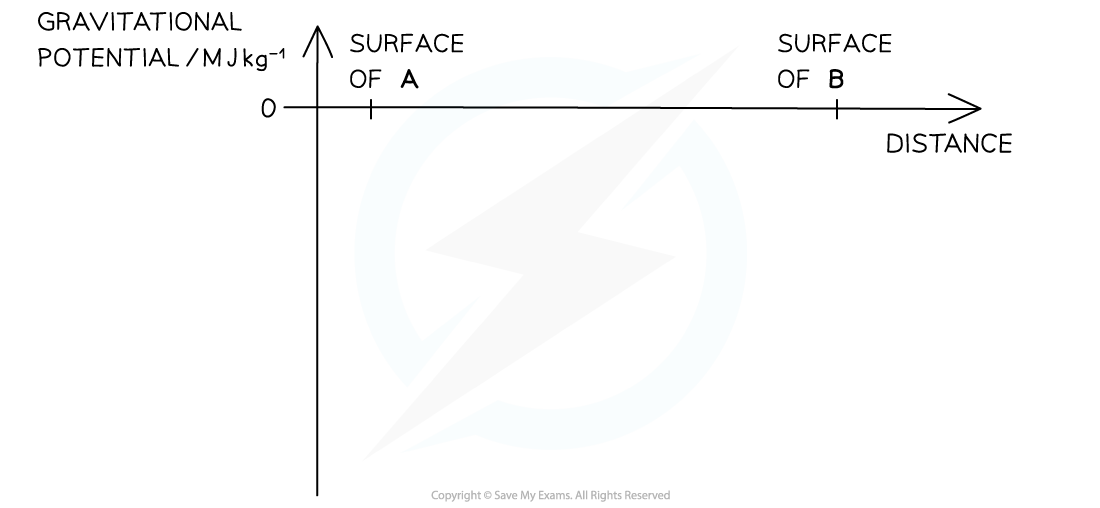
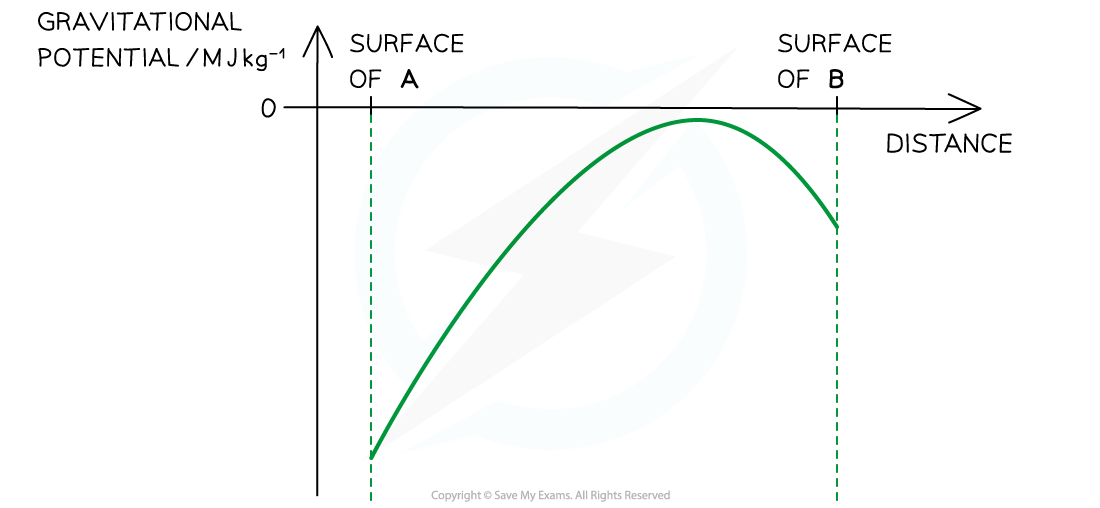
- Graph increases from a large negative value for V at the surface of A as distance increases
- Up to a value close to, but below 0 near the surface of planet B
- The graph then falls near the surface of planet B
- From a point much closer to planet B than A
Exam Tip
Drawing, interpreting or calculating from either of these graphs are common exam questions. The graph of g against r should start off steeper and decrease rapidly compared to that of V against r, to distinguish it as an inverse square law (1/r2) relation instead of just 1/r.
转载自savemyexams
以上就是关于【AQA A Level Physics复习笔记7.2.3 Graphical Representation of Gravitational Potential】的解答,如需了解学校/赛事/课程动态,可至翰林教育官网获取更多信息。
往期文章阅读推荐:
全网破防!ALevel CIE数学M1疑似错题?经济P2难度飙升?5月6日大考考情分析必看!
A-Level CIE就大规模泄题发布最严处罚!哪些考生必须重考?你的成绩怎么办?


翰林AMC8视频课重磅上线!

国际竞赛真题资源免费领取


