AQA A Level Physics复习笔记4.3.2 Motion Graphs

Motion Graphs
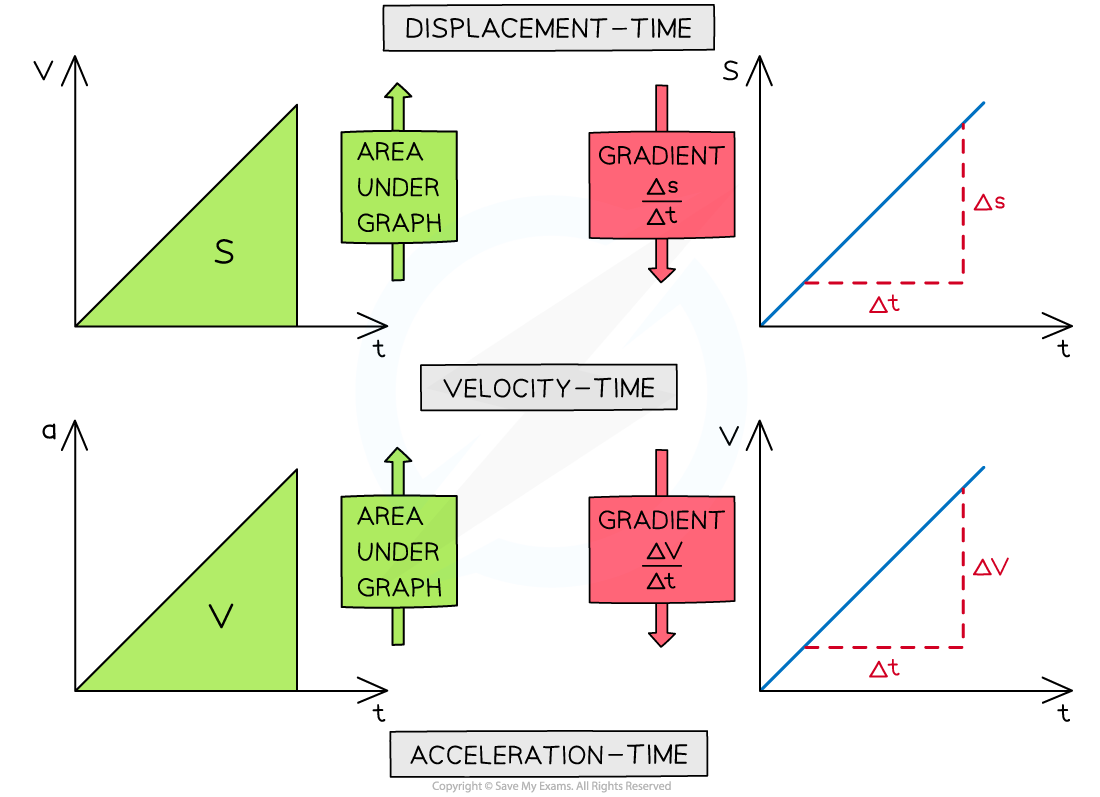
Gradients
- The gradient of a displacement-time graph is the velocity
- The gradient of a velocity-time graph is the acceleration
Area Under the Graph
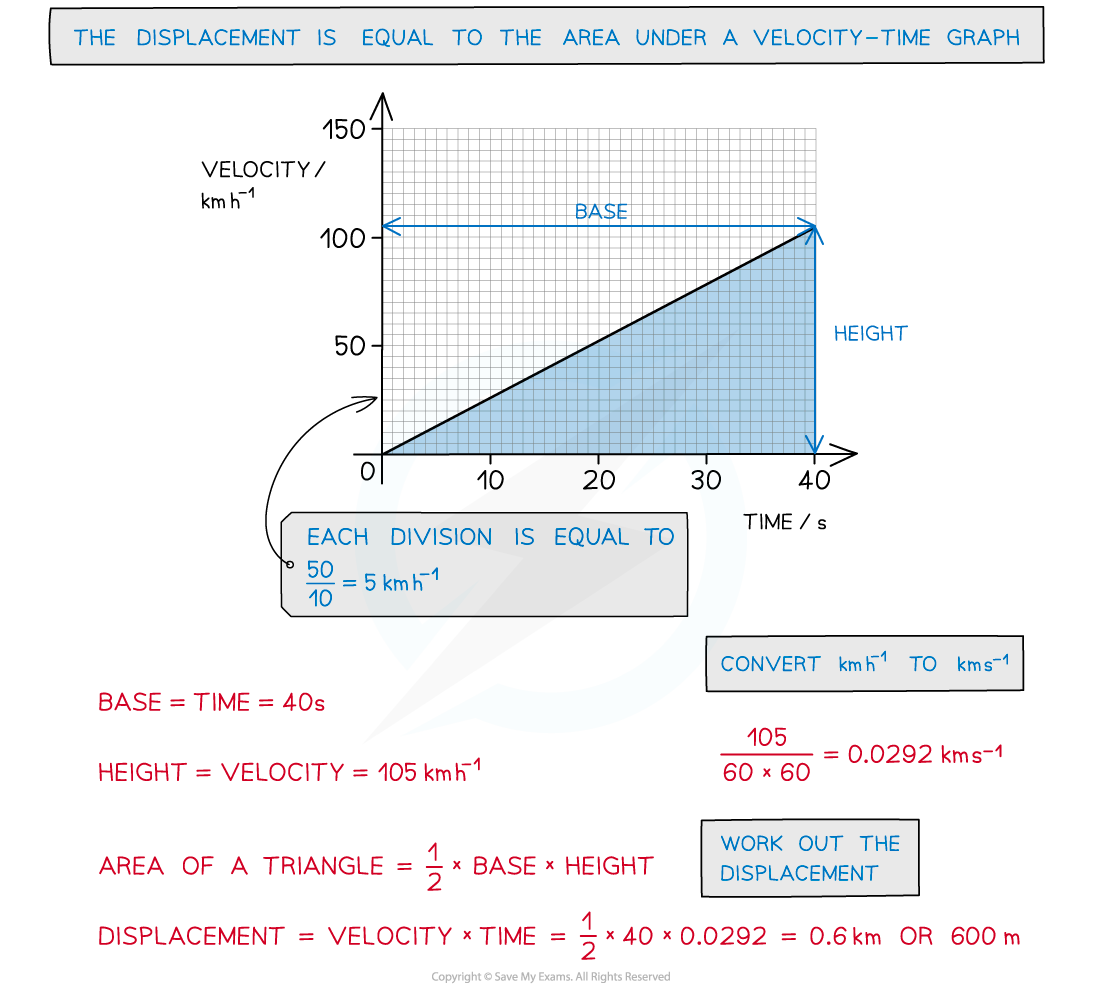
- The area under a velocity-time graph is the displacement
- The area under an acceleration-time graph is the velocity
Motion of a Bouncing Ball
- For a bouncing ball, the acceleration due to gravity is always in the same direction (in a uniform gravitational field such as the Earth's surface)
- This is assuming there are no other forces on the ball, such as air resistance
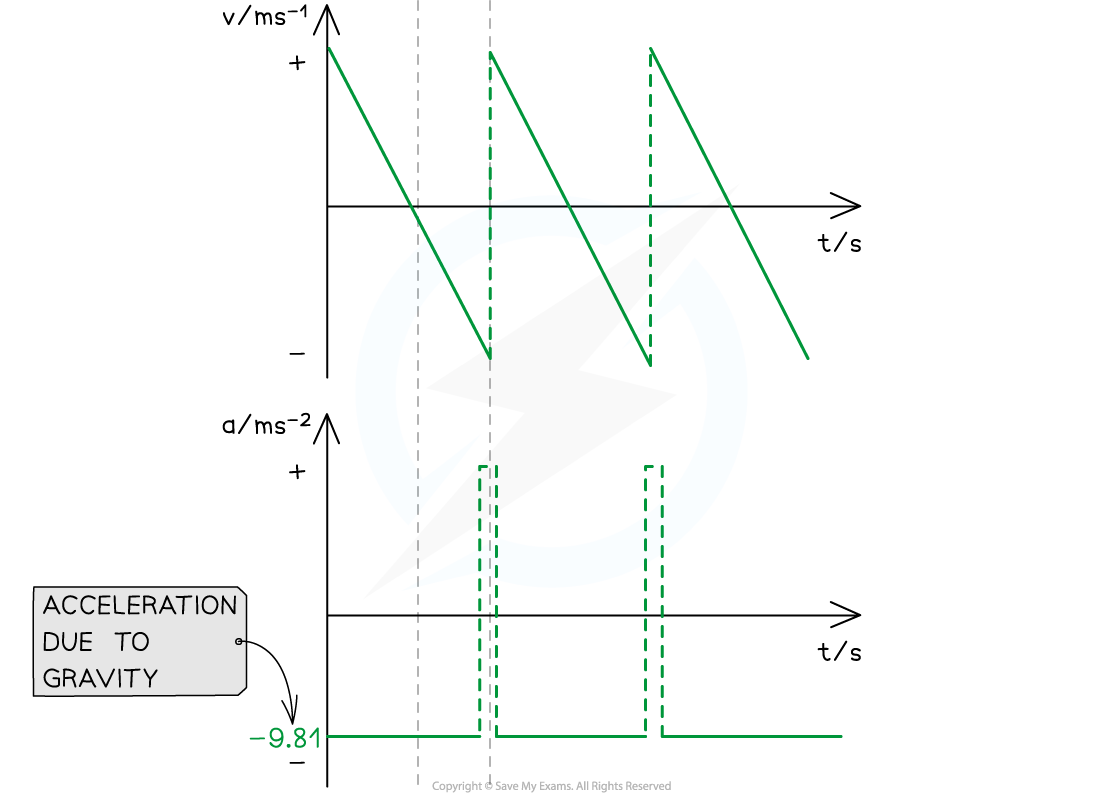
- Since the ball changes its direction when it reaches its highest and lowest point, the direction of the velocity will change at these points
- The vector nature of velocity means the ball will sometimes have a:
- Positive velocity if it is travelling in the positive direction
- Negative velocity if it is travelling in the negative direction
- An example could be a ball bouncing from the ground back upwards and back down again
- The positive direction is taken as upwards
- This will be either stated in the question or can be chosen, as long as the direction is consistent throughout
- Ignoring the effect of air resistance, the ball will reach the same height every time before bouncing from the ground again
- When the ball is travelling upwards, it has a positive velocity which slowly decreases (decelerates) until it reaches its highest point
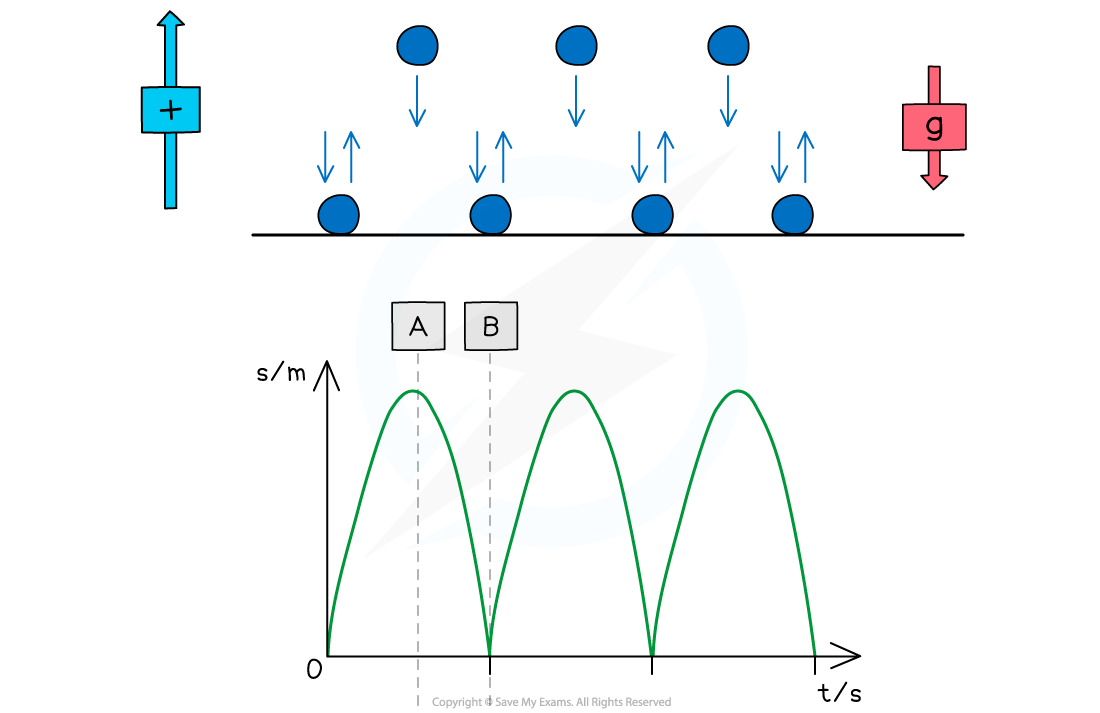
- At point A (the highest point):
- The ball is at its maximum displacement
- The ball momentarily has zero velocity
- The velocity changes from positive to negative as the ball changes direction
- The acceleration, g, is still constant and directed vertically downwards
- At point B (the lowest point):
- The ball is at its minimum displacement (on the ground)
- Its velocity changes instantaneously from negative to positive, but its speed (magnitude) remains the same
- The change in direction causes a momentary acceleration (since acceleration = change in velocity / time)
Worked Example
The velocity-time graph of a vehicle travelling with uniform acceleration is shown in the diagram below.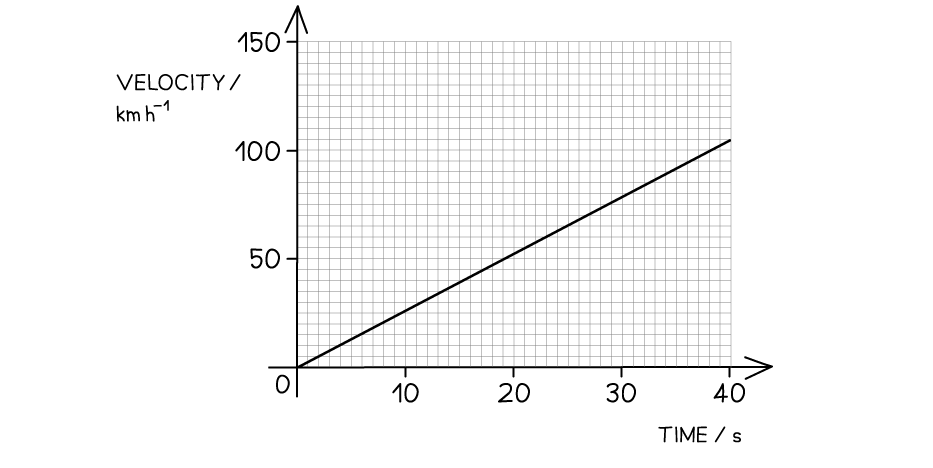 Calculate the displacement of the vehicle at 40 s.
Exam Tip
Always check the values given on the y-axis of a motion graph - students often confuse displacement-time graphs and velocity-time graphs.The area under the graph can often be broken down into triangles, squares and rectangles, so make sure you are comfortable with calculating area!
转载自savemyexams
以上就是关于【AQA A Level Physics复习笔记4.3.2 Motion Graphs】的解答,如需了解学校/赛事/课程动态,可至翰林教育官网获取更多信息。
往期文章阅读推荐:
全网破防!ALevel CIE数学M1疑似错题?经济P2难度飙升?5月6日大考考情分析必看!
A-Level CIE就大规模泄题发布最严处罚!哪些考生必须重考?你的成绩怎么办?


翰林AMC8视频课重磅上线!

国际竞赛真题资源免费领取


