2017 AP Statistics统计学真题Practice Exam系列之选择题免费下载

历年AP Statistics统计学系列
真题与答案下载
![]()
翰林国际教育全网首发
力争超快速发布最全资料
助你在升学路上一帆风顺
为你的未来保驾护航
2017 AP Statistics Practice Exam Multiple Choice Questions Free Download
2017 AP统计学模考选择题部分免费下载
此套题共计1小时30分钟,共40题
占总分50%
仅可使用铅笔答题
可以使用图形计算器
考试时会提供常用公式表
完整版下载链接见文末
部分真题预览:
1)Researchers conducted a telephone survey of 427 adults living in a large city. The adults were asked whether they planned to purchase a smart watch in the next year. The table shows the responses categorized by the region of the city in which the residents live.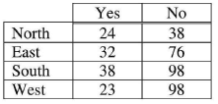
Which of the following graphical displays is most appropriate for comparing the proportions of those surveyed who plan to purchase a smart watch within the four regions?
- A scatterplot
- A boxplot
- A segmented bar chart
- A back-to-back stemplot
- A dotplot
2) A scientist recorded the duration of the eruptions of the Old Faithful geyser in Yellowstone National Park that occurred during a one-month time period. The histogram below shows the distribution of the duration, in seconds, of the eruptions.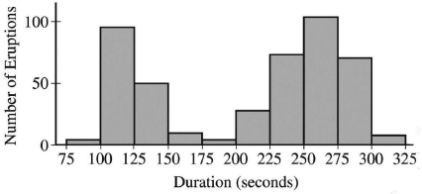
Based on the histogram, which of the following is the best description of the distribution?
- The distribution is uniform, is centered at about 200 seconds, and has a range of at most 250 seconds.
- The distribution is skewed to the left, is centered at about 125 seconds, and has range of at most 250 seconds.
- The distribution is skewed to the right, is centered at about 160 seconds, and has a range of at most 250 seconds.
- The distribution displays two clusters, has a range of at most 200 seconds, and includes outliers below 75 seconds and above 325 seconds.
- The distribution displays two clusters, with one cluster centered at about 125 seconds and the other centered at about 260 seconds, and has a range of at most 250 seconds
4) Researchers used two footballs of the same size to examine the effect of helium on kicking distance. One football was filled with air, and the other was filled with helium. Eleven people participated in the study. Each person kicked the football willed with air and the football filled with helium, and the kicking distances, in yards, were recorded. The football that was kicked first was determined by the flip of a fair coin, and the people did not know which football was filled with air and which was filled with helium. What type of study was conducted by the researchers and, of the following, which is the appropriated t-interval for inference?
- A completely randomized design and a t-interval for a difference between means for independent samples
- A completely randomized design and a t-interval for a mean difference
- A matched-pairs design and a t-interval for a difference between means for independent samples
- A matched-pairs design and a t-interval for a mean difference
- An observational study and t-interval for a difference between means for independent samples
完整版真题资料可以底部二维码免费领取↓↓↓
咨询或AP报名请添加顾问微信

以上就是关于【2017 AP Statistics统计学真题Practice Exam系列之选择题免费下载】的解答,如需了解学校/赛事/课程动态,可至翰林教育官网获取更多信息。
往期文章阅读推荐:
2026年AP 5分率全科目汇总与深度解读(附2026年AP成绩公布时间及查分步骤)
2026年AP出分后操作全解析|送分、隐藏、取消、复议流程与AP学者奖说明


翰林AMC8视频课重磅上线!

国际竞赛真题资源免费领取


